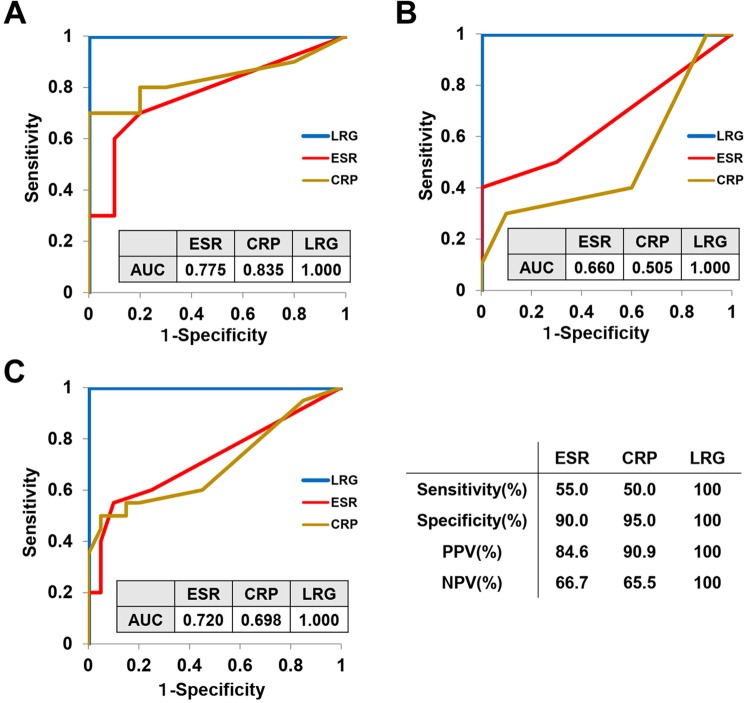
Figure 3.
Diagnostic performance of inflammatory biomarkers for active tuberculosis in macaques. Receiver operating characteristic (ROC) curve analyses for ESR, CRP and LRG in discrimination of active TB at 12 weeks after Mtb challenge were performed on the saline-treated macaques (A), BCG-treated macaques (B) and all macaques (C). The value of area under the ROC curve (AUC) of each biomarker is shown in the figure. Optimal cutoff values for ESR (2 mm/hr), CRP (0.14 mg/dL) and LRG (8.22 μg/mL) were determined by the ROC curve analysis of all macaques (C) and were used to calculate sensitivity, specificity, positive predictive value and negative predictive value of each biomarker.

