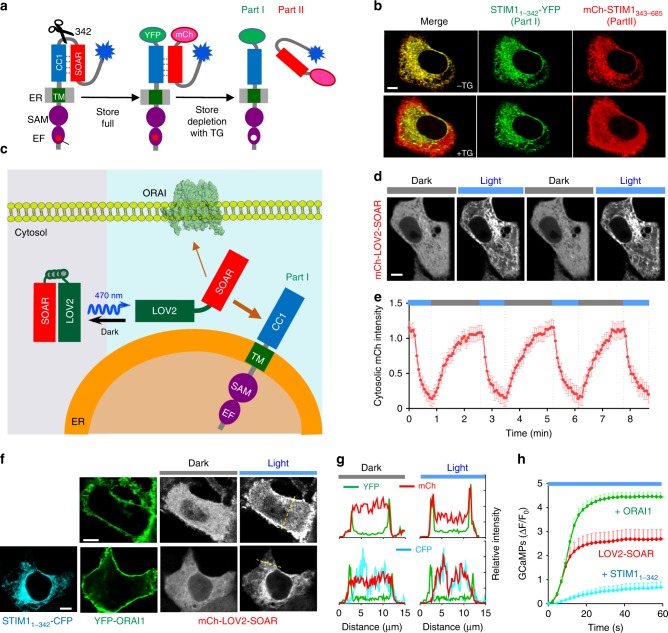
Fig. 2. An engineered LOV2-SOAR chimera to mimic STIM1ct autoinhibition mediated by CC1–SOAR interaction.
Data were shown as mean ± sem. Scale bar, 5 µm. a Design of a split STIM1 molecule (at residue 342) to monitor CC1–SOAR interaction in trans at real time. CC1–SOAR maintains STIM1ct in an inactive configuration at rest. As a result, Part II (mCh-STIM1342–685) tightly docks to the ER-resident Part I (STIM11–342-YFP) when the store remains full. Upon store depletion, structural changes propagate toward the CC1 region to weaken its association with SOAR, thereby leading to the cytosolic dispersion of Part II as shown in panel b. b Confocal images showing the distribution of split STIM1 molecules (green, STIM11–342-YFP; red, mCh-STIM1343–685) before and after thapsigargin (TG)-induced store depletion in HeLa cells. c Schematic illustrating the design of a LOV2-SOAR (STIM1336–486) chimera to mimic the CC1–SOAR interaction that locks STIM1ct in an inactive state. CC1 is replaced by LOV2 (light-oxygen-voltage domain 2) to tightly cage SOAR in the dark. Upon blue light stimulation, the Jα helix becomes disordered to uncage SOAR, thereby restoring its activity to engage and gate ORAI channels. If the ER-resident Part I (STIM11–342-YFP) and PM-embedded ORAI1 are co-expressed, LOV2-SOAR can be used to determine the relative binding strength of SOAR toward ER-anchored CC1 or PM-resident ORAI1 channels. d Light-inducible cytosol-to-ER translocation of mCh-LOV2-SOAR in HEK293 cells co-transfected with Part I as shown in panel c. e Quantification of cytosolic mCherry signals (images in panel d) following three repeated light-dark cycles (n = 18 cells). f–h Comparison of the relative strength of SOAR-CC1 and SOAR-ORAI1 interactions. f Top: Light-induced cytosol-to-PM translocation of mCh-LOV2-SOAR (gray) observed in HEK293 cells co-transfected with YFP-ORAI1 (green). Bottom: Confocal images of HEK293 cells co-expressing mCh-LOV2-SOAR (gray), YFP-ORAI (green) and STIM11–342-CFP (cyan). In the dark, mCh-LOV2-SOAR was evenly distributed in the cytosol. Upon photostimulation, mCh-LOV2-SOAR preferred to translocate toward ER membrane but not to PM. g The fluorescence intensities (YFP, green; mCh, red; CFP, cyan) across the dashed line were plotted to evaluate the degree of colocalization. h Light-induced Ca2+ response curves (quantified by GCaMP6s) in HEK293 cells transfected with LOV2-SOAR (red), LOV2-SOAR + ORAI1 (green) or LOV2-SOAR + Part I (STIM11–342; blue). n = 30 cells.

