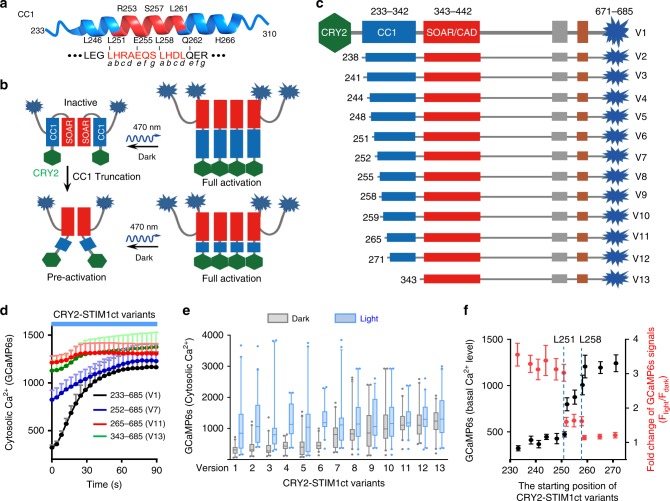
Fig. 3. Optogenetic mapping of the CC1–SOAR contact interface that mediates STIM1ct autoinhibition.
Data were shown as mean ± sem. Scale bar, 5 µm. a The 3D structure of the juxta-ER membrane region of CC1 (selected residues 241–271; PDB entry: 4O9B), with the predicted helical heptad repeats indicated below the cartoon. b, c Summary of the anticipated outcomes in HeLa cells transfected with the full-length or truncated STIM1ct variants. CRY2-fusion constructs were depicted in panel c. d–f Light-triggered Ca2+ responses for the indicated CRY2-STIM1ct variants. d GCaMP6s was used to report the basal level of Ca2+ and light-induced changes of Ca2+ influx in HeLa cells. e Box-whisker plots showing the GCaMP6s signals before (gray) and after photostimulation (blue) for the indicated CRY2-STIM1ct variants. Data were presented as median and the interquartile range with 5–95 percentile distribution. f The basal Ca2+ levels (left Y axis, black dots) and fold-change of Ca2+ signals (right Y axis, red dots) plotted against the starting residues of tested CRY2-STIM1ct variants (X-axis). n = 40 cells from three independent experiments.

