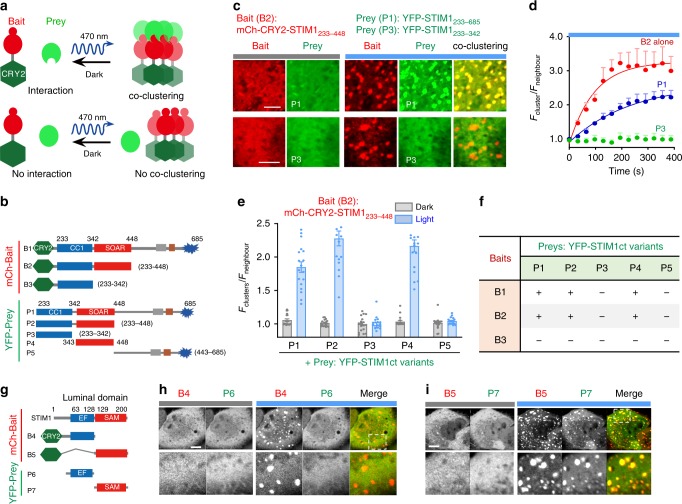
Fig. 4. An optogenetic clustering assay to dissect key determinants of STIM1 oligomerization.
Data were shown as mean ± sem. Scale bar, 5 µm. a Design of an optogenetic clustering assay to examine real-time protein–protein interactions in living cells. b Summary of mCh-tagged baits and YFP-tagged preys used to map critical domains in STIM1ct that dictate STIM1 oligomerization. c Representative confocal images showing the intracellular distribution of the bait (mCh-CRY2-STIM1233–448) and two different preys (P1—top panel, YFP-STIM1233–658; P3—bottom panel, YFP-STIM1233–342) before and after blue light stimulation in HeLa cells. d Time courses showing the kinetics of light-induced clustering (Fcluster/Fneighbor) of the bait and its co-clustering with P1 (blue), but not with P3 (green), as seen in panel c. n = 18 cells. (e) Quantification of the degrees of light-inducible co-clustering for the five indicated preys in HeLa cells co-transfected with the bait. n = 18 cells from three independent experiments. f Summary of the optogenetic co-clustering assay results for the bait–prey combinations shown in panel b. “+” means co-clustering notably observed after photo-illumination; “−” means no appreciable cluster formation before and after blue light stimulation. g–i Light inducible co-clustering to dissect the STIM1 luminal EF-SAM domain. g Schematic showing the design of bait–prey constructs. h–i Representative confocal images of HeLa cells co-expressing (h) mCh-CRY2-EF (B4, STIM132–128, EF-hand; red) with YFP-EF (P6, green), or (i) mCh-CRY2-SAM (B5, STIM1128–200, SAM; red) with YFP-SAM (P7; red) under dark (left) and blue light (right). The selected regions (dashed boxes) were enlarged to aid visualization. Scale bar 5 µm.

