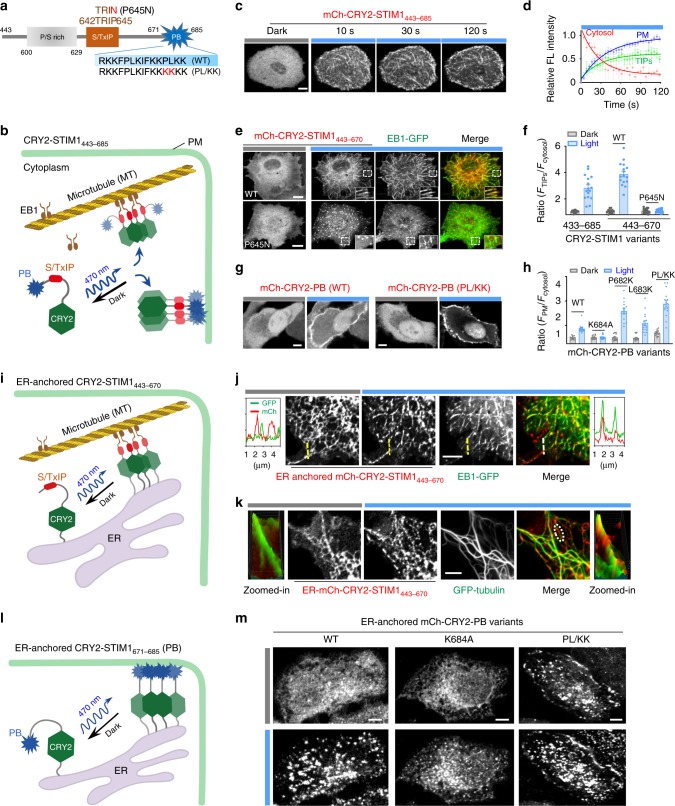
Fig. 6. Dissecting STIM1–microtubule (MT) and STIM1–PM interactions with optogenetic approaches.
Data were shown as mean ± sem. Scale bar, 5 µm. a Diagram of the STIM1 C-terminal fragment (residues 443–685) that contains both the S/TxIP EB1-binding motif and the positively charged polybasic tail (PB) that interacts with PM-resident PIPs. Mutations used in this study to perturb STIM1ct-target interactions were highlighted in red. b, c Schematic (b) and representative confocal images (c) showing light-inducible bimodal distribution (tracking of MT plus ends or cytosol-to-PM translocation) of mCh-CRY2-STIM1443–685 in COS-7 cells. d Time courses of light-triggered MT plus-end tracking (green) and PM translocation (blue) of mCh-CRY2-STIM1443–685. Upon blue light illumination, cytosolic mCherry signals rapidly reduced (t1/2 = 18.2 ± 5.0 s), accompanied with the increase of MT tip tracking (t1/2 = 21.5 ± 7.3 s) or PM decoration (t1/2 = 27.6 ± 6.2 s). n = 12 cells. e, f Representative confocal images (e) and quantifications of MT plus-end tracking (f) of mCh-CRY2-STIM1ct variants (top, WT; bottom, P645N in the context of STIM1443–670) in COS-7 cells co-transfected with EB1-GFP (green). The bar graph showed the averaged values of MT tip-to-cytosol intensity ratio under dark and lit conditions. n = 16 cells from three independent experiments. g, h Representative confocal images in HeLa cells (g) and quantification of the cytosol-to-PM translocation (h) of the indicated CRY2-PB variants before and after blue light illumination. n = 16 cells from three independent experiments. i–k Schematic showing light inducible ER-MT interactions in COS-7 cells cotransfected ER-anchored mCh-CRY2-STIM1443–670 (red) with (j) EB1-GFP (green) or (k) GFP-tubulin (green). j Representative confocal images showing ER morphology change following blue light illumination. The mCherry and GFP fluorescent intensities across the dashed line were plotted next to the images to indicate the degree of signal overlaps. k Confocal images showing the clustering of ER-resident mCh-CRY2-STIM1443–670 along with GFP-tubulin (green) upon blue light illumination. The surface profiles of a selected area (oval) were presented to aid the visualization of subcellular distribution. l, m Light-inducible assembly of ER-plasma membrane contact sites (MCSs) mediated by ER-resident mCh-CRY2-PB (STIM1671–685). l Schematic of the design. m Representative confocal images of the footprint of HeLa cells transfected with mCh-CRY2-PB variants before and after blue light illumination.

