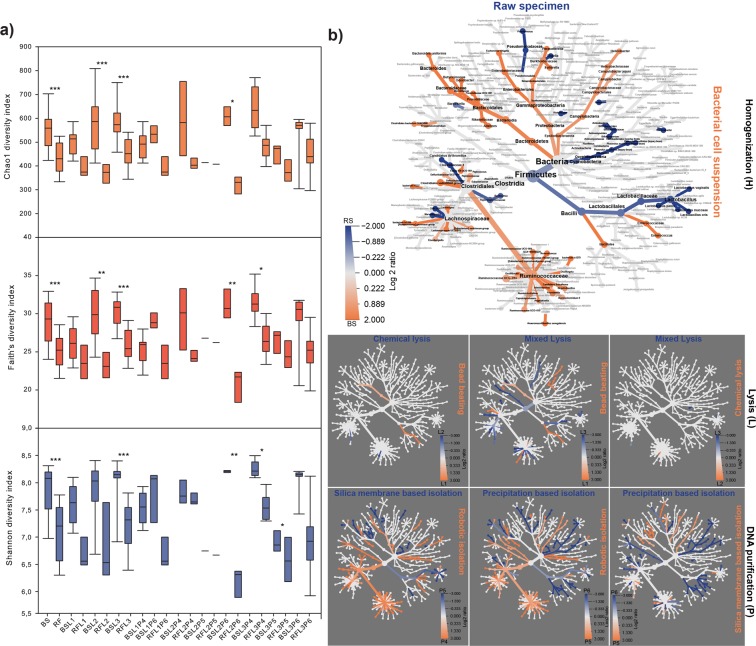
Figure 10.
Quantitative and qualitative representation of the protocol batch-effects on community diversity and the taxonomic classifications. (a) Alpha-diversity distributions summarize the related to metagenome DNA purification protocol variables. Whisker plots represent the interquartile ranges (IQR) with min/maximum values with significance (*P ≤ 0.05, **P ≤ 0.01, ***P ≤ 0.001) and the median. (b) To unravel significant distortions a composite figure with seven community heat trees was made to represent the effects of correlated parameters of sample processing (H), lysis (L) and DNA purification (P) on community taxonomy. The annotated tree functions as a key for the unlabeled trees. Colored taxons represents the extents of log2 differences in taxa abundances. For instance, the annotated tree on the left allows a quantitative representation of diversity distortions by correlating the parameters of sample pre-processing (RS vs. BS) where taxa colored blue is enriched in RS samples shown in the column and those colored orange are enriched in BS shown in the row.

