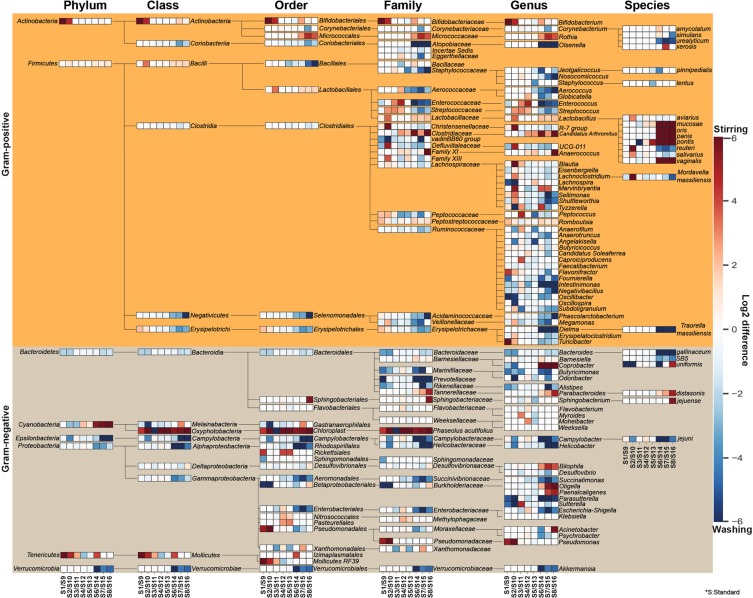
Figure 4.
Remarkable abundance variations were observed in community structures. Composite heat map was created to pronounce the distortions in taxonomic profiles on the basis of normalized abundance data associated to eight standard metagenome DNA isolation methods for comparison of the impact of two different sample homogenization strategies (RS vs. BS). Extents of differences are illustrated on the composite heat-map with gradient colors where red scale represents dominance of taxa owed to processing raw specimens homogenized due to stirring; log2(RS/BS) >0 whereas blue scale represents the overrepresentation of taxa associated to bacterial suspensions; log2(RS/BS) <0. Significant shifts in abundances of the 143 taxa affected by the batch-effects can be observed.

