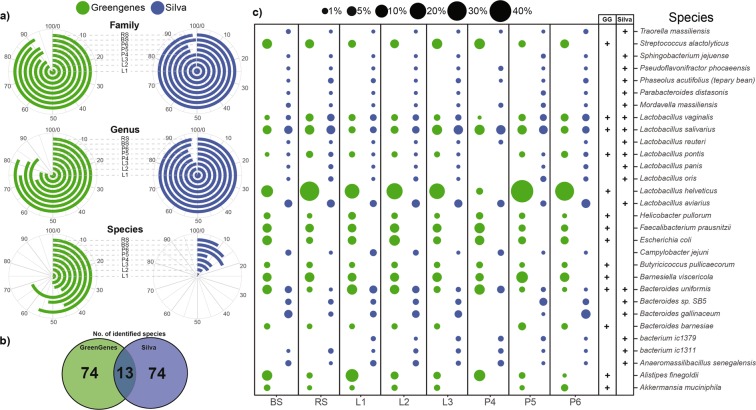
Figure 9.
Dependence of the proportion of the classified reads across family and genus levels and remarkable ambiguity in the species resolution. (a) Polar plots show the percentages of the identified reads at family (L5), genus (L6) and species (L7) taxonomic levels bound to protocol manipulations. Angles of the radial coordinate systems represent the percentages of identified reads at dedicated taxonomic ranks. Increasing percentages are ordered in clockwise orientation. (b) Bubble charts are shortlisting the relative frequencies of the 30 most abundant species representing the species mining power of the Silva and GreenGenes annotation tools.

