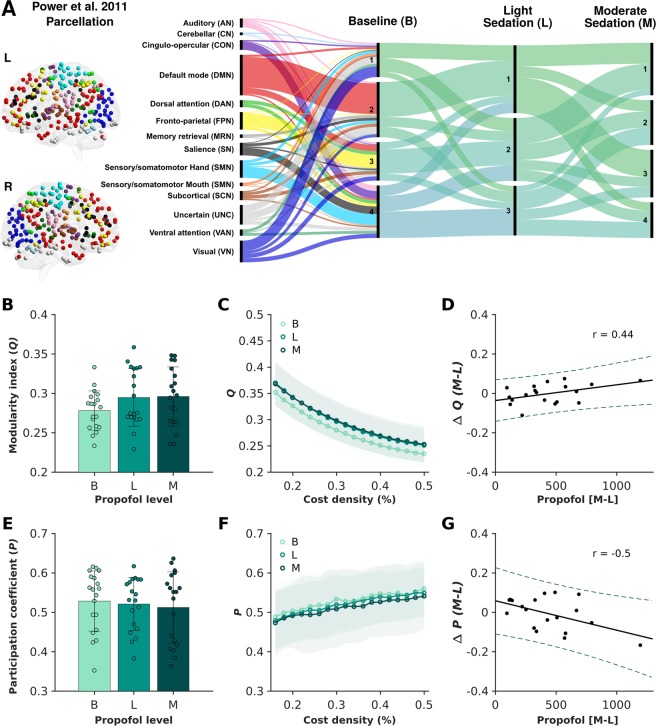
Figure 1.
Preservation of the modular brain network organisation across baseline and two stages of propofol-induced sedation. Based on the consensus partitioning of individual brain graphs across the chosen cost densities (16 to 50% in 2% increments), between three to four broad communities were identified in all three experimental conditions (panel A). The corresponding Alluvial diagram shows the flow in the consensus community affiliations of 258 regions of interest (ROIs) from a previously introduced parcellation scheme (Power et al.61) across baseline resting state, as well as light and moderate propofol-induced sedation conditions. Modularity index (Q) and participation coefficient (P) did not show statistically significant alterations across experimental conditions (panels B,E) and across the chosen range of cost densities (panels C,F). Bars represent the standard error with the distribution of individual values provided for each measurement across each experimental condition. Notably, there was a significant correlation between the change in modularity index (Q) (r = 0.44, p = 0.029; panel D) as well as the change in participation coefficient (P) (r = −0.50, p = 0.014; panel G) and blood plasma propofol concentration when comparing the two propofol-induced sedation conditions at the percolation threshold (16% cost density). While straight lines indicate the linear fit, dotted lines represent the 95% confidence intervals.

