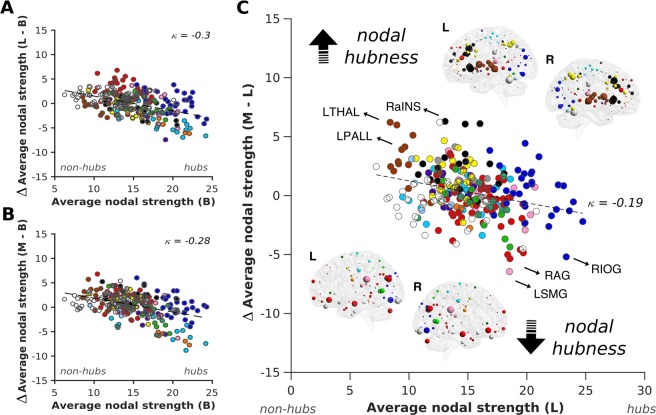
Figure 2.
Reorganisation of brain hubs with propofol-induced sedation. A radical reorganisation of brain hubs was observed across the two levels of propofol-induced sedation as compared to the baseline resting state condition. κ was calculated as the slope of a linear fit to the scatterplot of average functional connectivity strength between a chosen condition (light or moderate) and the difference between this condition and baseline resting state recording for each participant (panels A,B). When directly assessing sedation-level-dependent disruptions to the hub structure between moderate and light sedation conditions, regions belonging to the transmodal default mode (e.g. RAG = right angular gyrus), as well as the unimodal visual (e.g. RIOG = right inferior occipital gyrus), auditory (e.g. LSMG = left supramarginal gyrus) and sensory/somatomotor networks showed a marked decrease in their hubness, while those assigned to the subcortical (LTHAL = left thalamus, LPALL = left pallidum) and salience (RaINS = right anterior insula) networks displayed a strong increase in their nodal strength (panel C). Network nodes are colour-coded based on the Power et al.61 parcellation scheme. The size of nodes on the MNI glass brains indicates the magnitude of change in the nodal strength for each brain region. While the top glass brains show increase in nodal hubness, the lower glass brains indicate decreases in nodal hubness with the same external manipulation.

