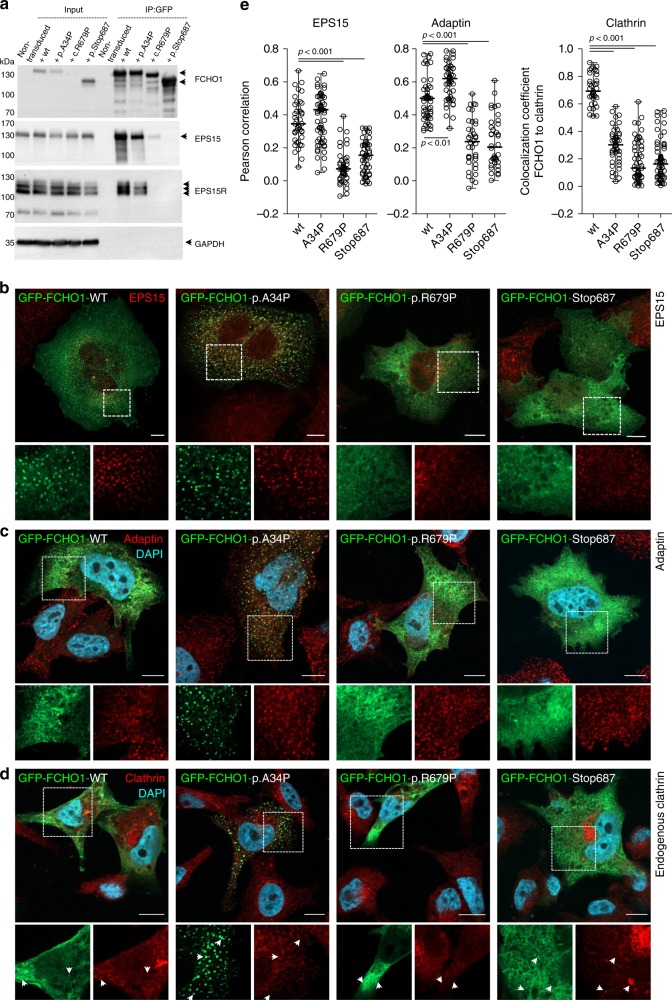
Fig. 2. Patient-associated mutations alter either binding properties or subcellular localisation of the FCHO1 protein.
a Whole-cell lysates from HEK293T cells overexpressing either wt or indicated mutant GFP-FCHO1 fusion proteins were used for immunoprecipitation. Specific bands are indicated with arrows. Anti-FCHO1 or anti-GFP antibodies were used independently to detect FCHO1-specific bands. Representative data of three independent experiments are shown. Uncropped blots are shown in Supplementary Fig. 4. b–d FCHO1-deficient SK-MEL-2 cells expressing RFP-tagged clathrin light chain from endogenous locus (CLTARFP/wt) were transiently transfected with either wt or mutated GFP-FCHO1 and fixed 24 to 36 h post transfection. Representative confocal microscopy pictures show that the F-BAR-domain-associated mutation p.A34P alters the subcellular localisation of FCHO1 and leads to the formation of large aggregates dissociated from the plasma membrane. The µHD domain-associated mutations (p.R679P and p.Stop687) abolish the interaction of FCHO1 with its interacting partners EPS15, and adaptin. All mutations obliterate interaction with endogenous clathrin. Enlarged and colour-separated regions corresponding to boxed areas are shown below each main picture. In d arrows indicate presumptive interaction of clathrin with wild-type FCHO1 and lack of such interaction for all tested mutants. Scale bar represents 5 µm for main pictures and 10 µm for enlarged regions. Colour code: b–d GFP-FCHO1, green; DAPI, blue, b EPS15, c adaptin, d clathrin–red. e Quantification of data shown in b to d. Pearson correlation or co-localisation coefficients of FCHO1 wild-type and all tested mutants with EPS15, adaptin and clathrin. Pooled data of two to three independent experiments are depicted. Each symbol represents one region of 25 µm2. Up to three regions per cells were quantified. Horizontal lines indicate the median, whiskers indicate the range (min to max). Statistical analysis of significance was performed using one-way ANOVA test followed by Tukey’s multiple comparison test to assess differences between groups. Source data are provided as a Source Data file.

