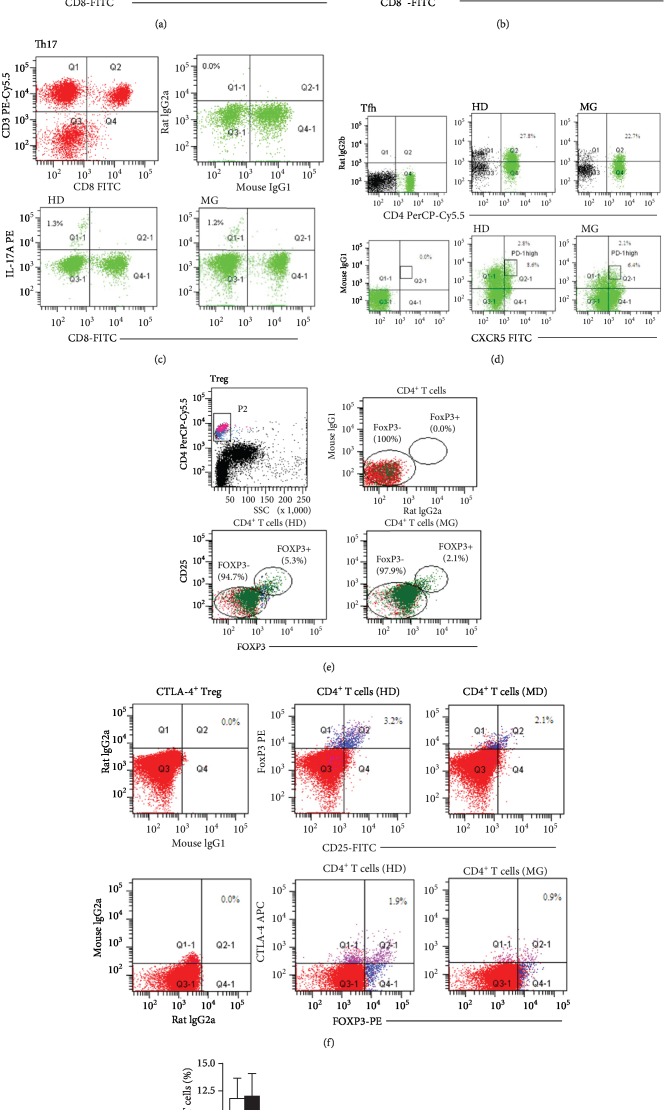
Figure 1.
Phenotypic profiles of CD4+ T cell subsets reveal underrepresentation of Treg and CTLA-4+ Treg in MG patients. Representative FACS analysis of PBMCs from healthy donors and untreated MG patients was shown based on cell surface markers and/or intracellular cytokines for CD4+IFN-γ+ Th1 cells (a), CD4+IL-4+ Th2 cells (b), CD4+IL-17A+ Th17 cells (c), CD4+CXCR5+PD-1high Tfh cells (d), CD4+CD25+FOXP3+ Treg cells (e) and CD4+CD25+FOXP3+CTLA-4+ Treg cells (f). G. Comparison of the mean frequency of CD4+ T cell subsets based on FACS analysis using the aforementioned markers in healthy donors (n = 59) and untreated MG patients (n = 39). Data are expressed as mean ± SD. ∗P < 0.05.

