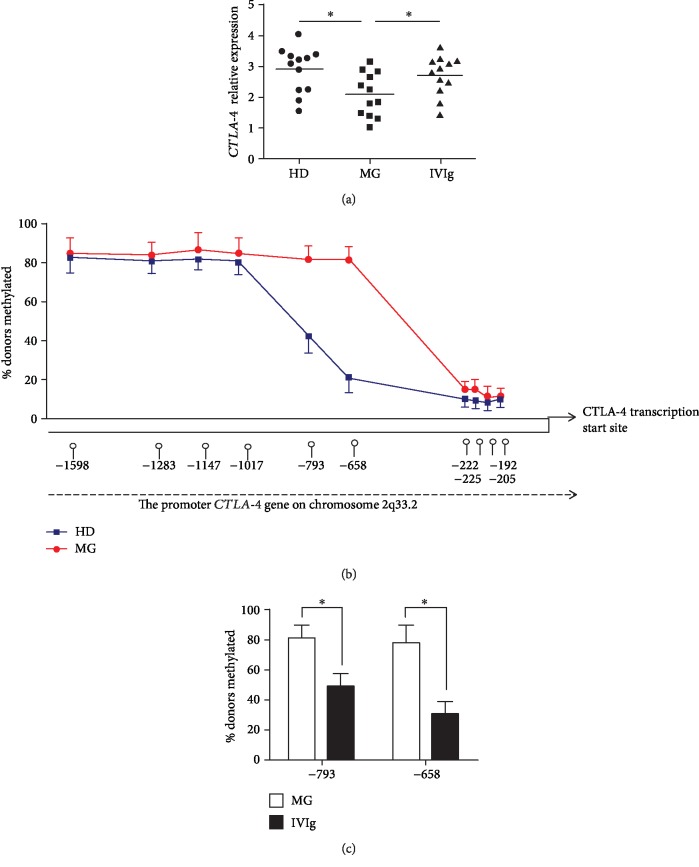
Figure 5.
Quantitative analysis of CTLA-4 mRNA in Treg cells from myasthenia gravis patients (MG) and healthy donors (HD). (a) Total RNA was extracted from sorted Treg cells of MG and HD and then real-time PCR was performed to measure CTLA-4 mRNA level. (b) Genomic DNA was prepared from sorted Treg cells and methylation status within CTLA-4 promoter was detected. The methylation percentage within CTLA-4 promoter in Treg cells from HD and MG (n = 10) was shown. (c) The methylation percentage at -658 and -793 CpGs in Treg cells from MG and MG with IVIg therapy (n = 12) is shown. Data are expressed as mean ± SD. ∗P < 0.05.

