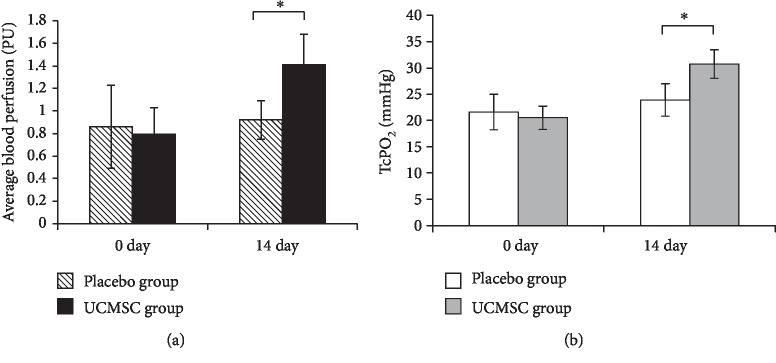
Figure 4.
The quantitative analysis of microvascular hemodynamic parameters of periwound tissues. (a) Transcutaneous oxygen pressure (TcPO2) in patients of the placebo and UCMSC groups before and 14 days after treatment. (b) Average blood perfusion in patients of the placebo and UCMSC groups before and 14 days after treatment (t-test; ∗reliability of the differences at p < 0.05).

