Figure 1.

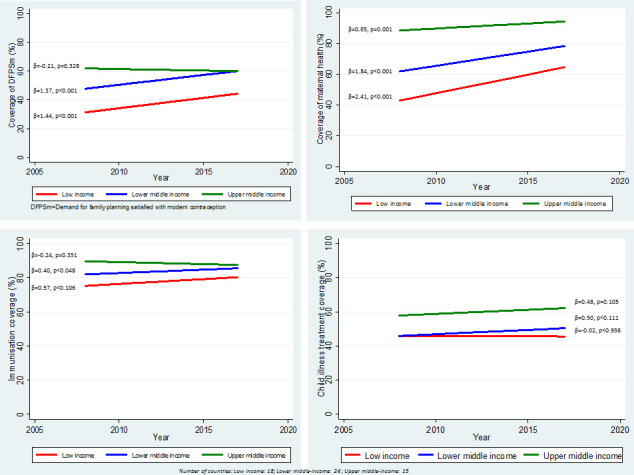
Trends in coverage of four components of the RMNCH along the continuum of care on the period 2008-2017 by countries categorized by income group. (β represents the slope of the line, p is p-value associated with the slope).

Trends in coverage of four components of the RMNCH along the continuum of care on the period 2008-2017 by countries categorized by income group. (β represents the slope of the line, p is p-value associated with the slope).