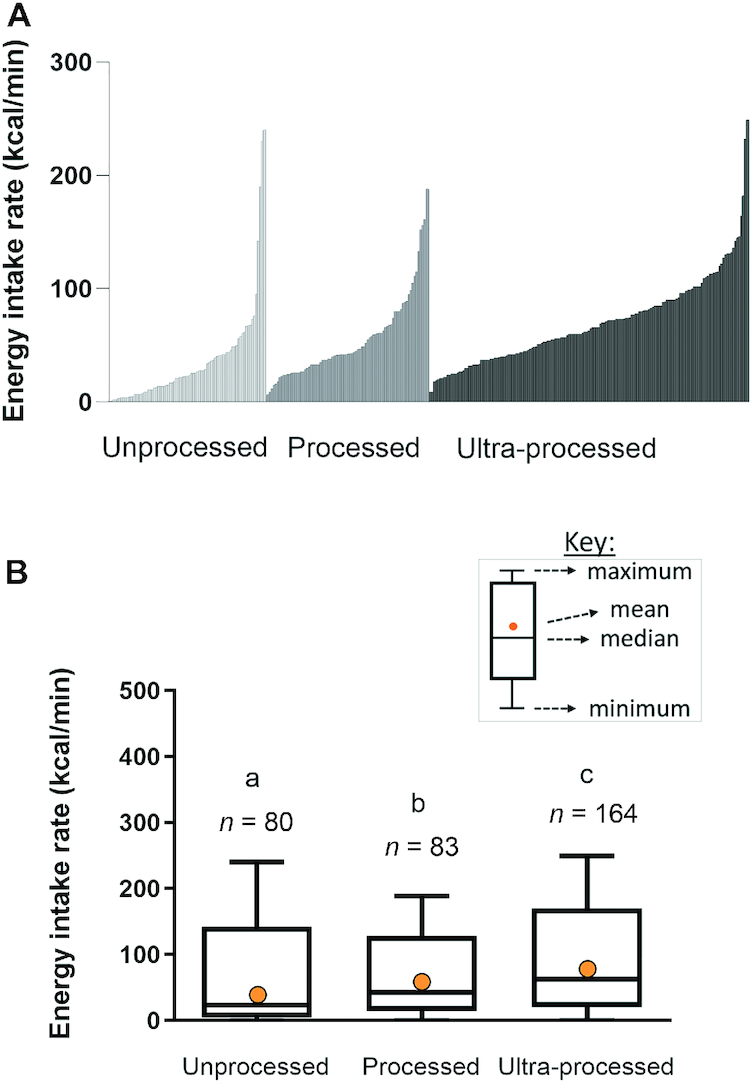
FIGURE 1.

(A) Energy intake rates (kcal/min) ranked within each NOVA classification from low to high for the 3287 foods from unprocessed (light gray), processed (gray), and ultra-processed (black) foods separately. (B) Boxplot summary of the energy intake rate (kcal/min) for unprocessed, processed, and ultra-processed foods (1-factor ANOVA confirmed significant differences between categories, different letters indicate significant differences at P < 0.05; Least Significant Difference post hoc comparison).
