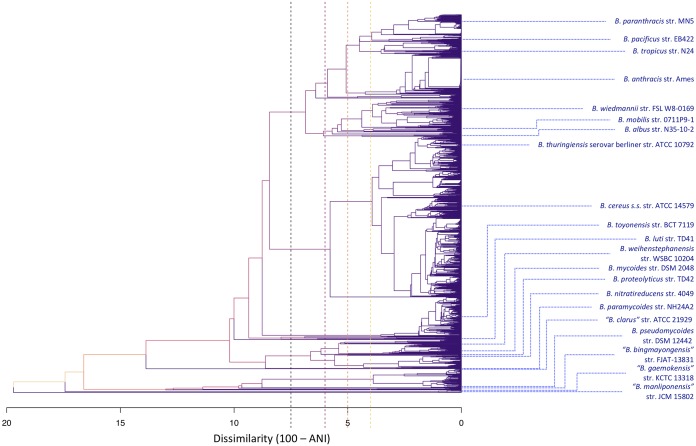
FIG 1.
Dendrogram constructed using symmetric pairwise average nucleotide identity (ANI) dissimilarities calculated between 2,218 B. cereus group genomes from NCBI’s RefSeq database with N50 of >20 kbp (i.e., in Materials and Methods) and the average linkage hierarchical clustering method implemented in the hclust function in R. Blue tip labels denote the location of species type strain/reference genomes in the dendrogram, while tree height corresponds to ANI dissimilarity. Branch colors correspond to branch height within the tree. Dashed vertical lines appear at dissimilarities of 7.5, 6, 5, and 4, which correspond to ANI thresholds of 92.5, 94, 95, and 96, respectively (from left to right in order of appearance along the x axis).

