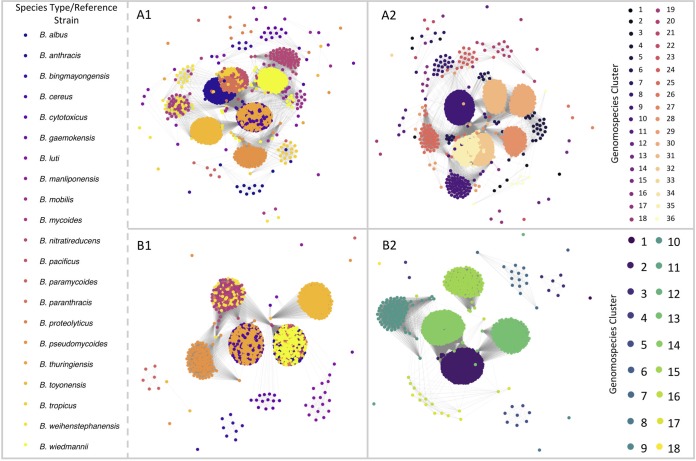
FIG 2.
Weighted undirected graphs constructed using symmetric pairwise average nucleotide identity (ANI) values calculated between 2,218 B. cereus group genomes from NCBI’s RefSeq database with N50 of >20 kbp (i.e., in Materials and Methods). Nodes represent individual genomes, while weighted edges connect each pair of genomes with a mean ANI value of ≥95 (A) and ≥92.5 (B), where edge weight corresponds to the mean ANI value of the pair. Nodes (i.e., genomes) are colored by (i) closest matching type strain genome or (ii) closest matching medoid genome of clusters formed at the respective ANI value. Graphs were constructed using the graphout layout algorithm implemented in R’s igraph package, using 1 million iterations and a charge of 0.02.

