FIG 4.
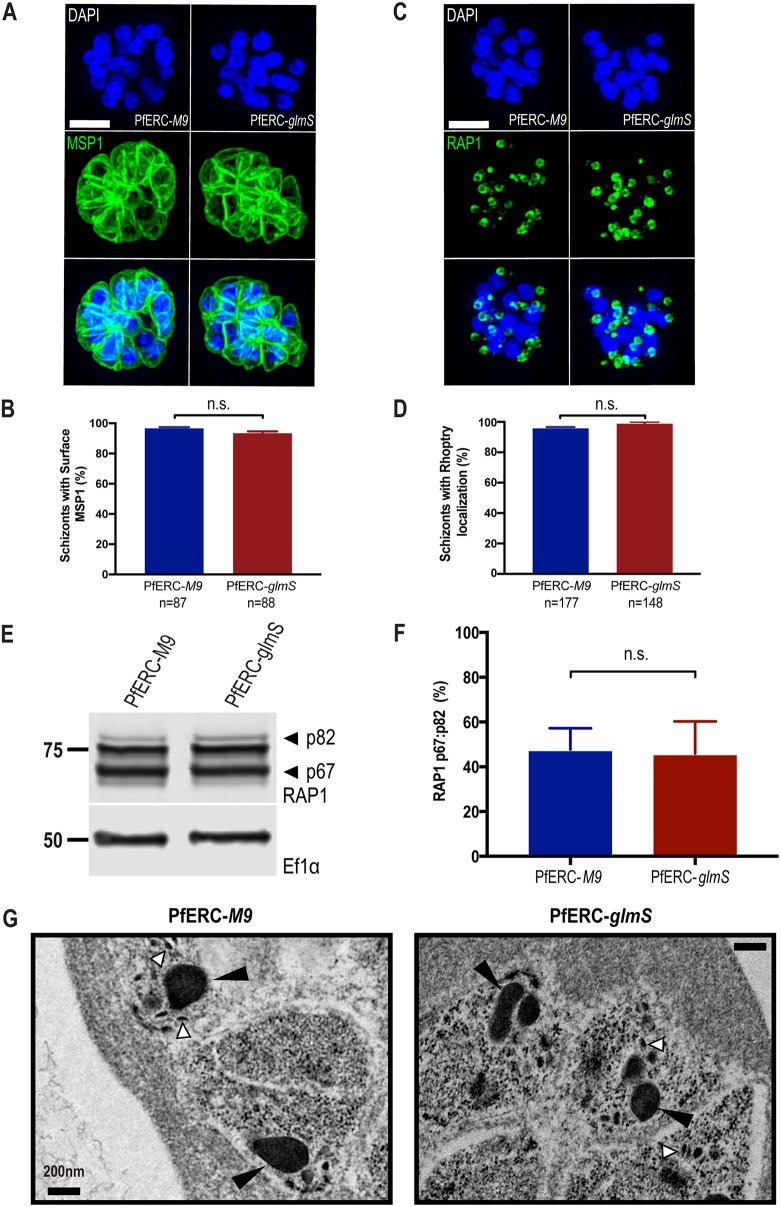
PfERC is not required for protein trafficking or organellar biogenesis. (A) Representative SIM images of PfERC-glmS and PfERC-M9 schizonts incubated with GlcN for 48 h and stained with anti-MSP1 and the nuclear stain DAPI. From top to bottom, the images are DAPI (blue), anti-MSP1 (green), and fluorescence merge. Bar, 2 μm. (B) The surface localization of MSP1 was quantified in PfERC-glmS and PfERC-M9 schizonts incubated with GlcN for 48 h and stained as described for panel A. Data are presented as means ± standard errors of the means (n = 2 biological replicates; n.s., nonsignificant; unpaired t test). (C) Representative SIM images of PfERC-glmS and PfERC-M9 schizonts incubated with GlcN for 48 h and stained with anti-RAP1 and the nuclear stain DAPI. From top to bottom, the images represent DAPI (blue), anti-RAP1 (green), and fluorescence merge. Bar, 2 μm. (D) The rhoptry localization of RAP1 was quantified in PfERC-glmS and PfERC-M9 schizonts incubated with GlcN for 48 h and stained as described for panel C. Data are presented as means ± standard errors of the means (n = 3 biological replicates; n.s., nonsignificant; unpaired t test). (E) Western blot of parasite lysates isolated from PfERC-glmS and PfERC-M9 schizonts grown in the presence of GlcN for 48 h and probed with anti-RAP1 (top panel) and anti-EF1α (loading control; bottom panel). Results of one representative experiment of five are shown. The sizes of the marker proteins that comigrated with the probed protein are indicated on the left. (F) Quantification of RAP1 processing in PfERC-glmS and PfERC-M9 parasites incubated with GlcN as described for panel E. Data were normalized to the ratio of processed RAP1 (p67/p82) of PfERC-M9 parasites and are presented as means ± standard errors of the means (n = 5 biological replicates; n.s , nonsignificant; unpaired t test). (G) Representative TEM images of synchronized PfERC-glmS and PfERC-M9 schizonts grown for 48 h with GlcN and incubated with C1 for 4 h, as shown in Fig. 3A (n = 2 biological replicates). Small arrowheads (white) point to micronemes, while large arrowheads (black) point to rhoptries. Bar, 200 nm.

