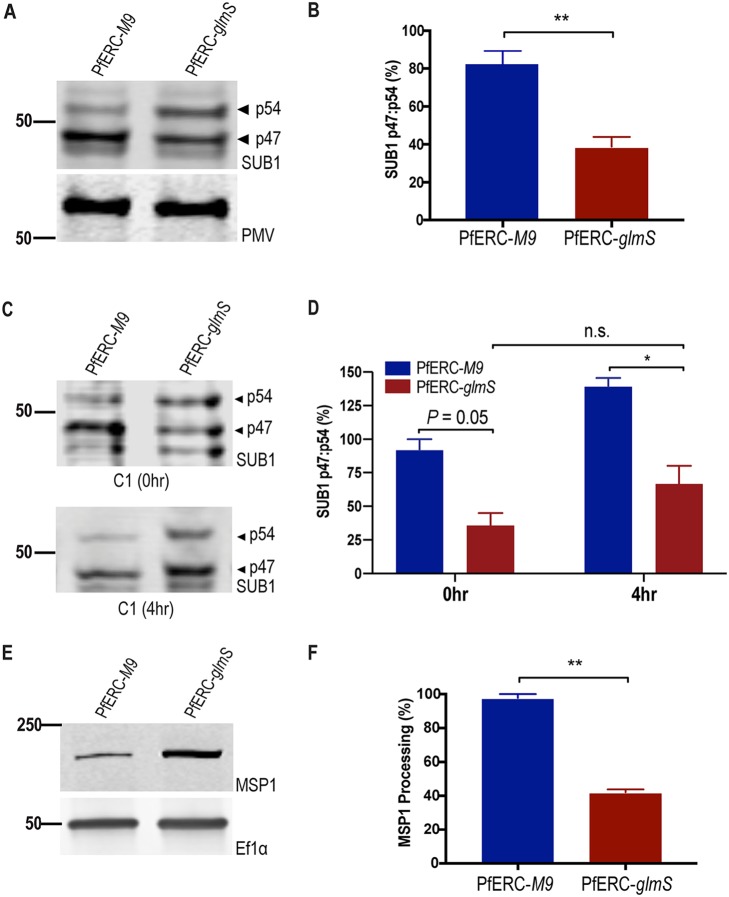
FIG 6.
PfERC knockdown inhibits SUB1 and MSP1 processing. (A) Western blot of parasite lysates isolated from PfERC-glmS and PfERC-M9 schizonts grown in the presence of GlcN for 48 h and probed with anti-SUB1 antibodies (top panel) and anti-PMV (loading control; bottom panel). Results of one representative experiment of four are shown. The sizes of the marker proteins that comigrated with the probed protein are indicated on the left. (B) Quantification of SUB1 processing in PfERC-glmS and PfERC-M9 parasites over time after addition of GlcN as described for panel A. Data were normalized to the ratio of processed SUB1 (p47/p54) of PfERC-M9 parasites and are presented as means ± standard errors of the means (n = 4 biological replicates; **, P < 0.005 [unpaired t test]). (C) Western blot of parasite lysates isolated from PfERC-glmS and PfERC-M9 schizonts grown in the presence of GlcN for 48 h and then incubated with compound 1. Samples were taken either 0 h or 4 h after addition of compound 1. (D) Quantification of SUB1 processing in PfERC-glmS and PfERC-M9 parasites incubated with compound 1 as described for panel C. Data were normalized to the ratio of processed SUB1 (p47/p54) of PfERC-M9 parasites at 0 h and presented as ± standard errors of the means. (n = 2 biological replicates; *, P < 0.05 [one-way ANOVA]). (E) Western blot of parasite lysates isolated from PfERC-glmS and PfERC-M9 schizonts grown in the presence of GlcN for 48 h and probed with anti-MSP1 12.4 antibodies (top panel) and with anti-EF1α (loading control; bottom panel). Results of one representative experiment of two are shown. (F) Quantification of unprocessed (or full-length) MSP1 in PfERC-glmS and PfERC-M9 parasites after addition of GlcN as described for panel E. Data were normalized to the loading control (EF1α) and are presented as means ± standard errors of the means (n = 2 biological replicates; **, P < 0.005 [unpaired t test]).

