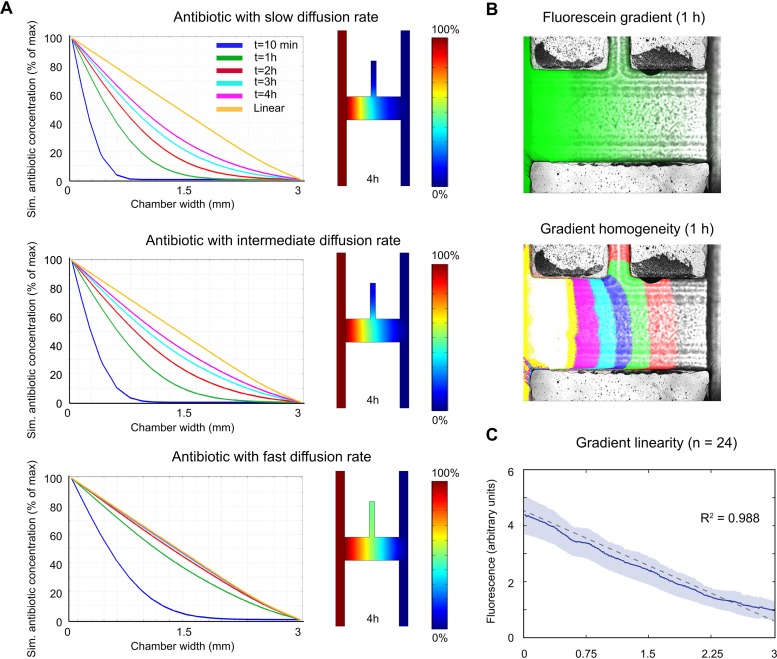
FIG 2.
Gradient characterization. (A) Simulations of the formation of antibiotic concentration gradients in the growth chamber, where the antibiotic for the simulation was assigned either a low (slow), intermediate, or high (fast) diffusion rate. The panels to the right show simulations of the concentrations of the respective antibiotics (with different diffusion properties) in the growth chamber and adjacent source and sink flow channels 4 h after onset of gradient generation from maximum (100%) (red) to low (0%) (blue) antibiotic concentration. (B) Gradient formation in the growth chambers was validated using fluorescein. Each colored field in the bottom panel corresponds to a portion of the gradient corresponding to 12.5% of the total gradient. (C) Average fluorescein gradient (solid line) (95% confidence interval indicated by the blue area) and the linear least-squares fit (dashed line) of the data (n = 24).

