Figure 3.

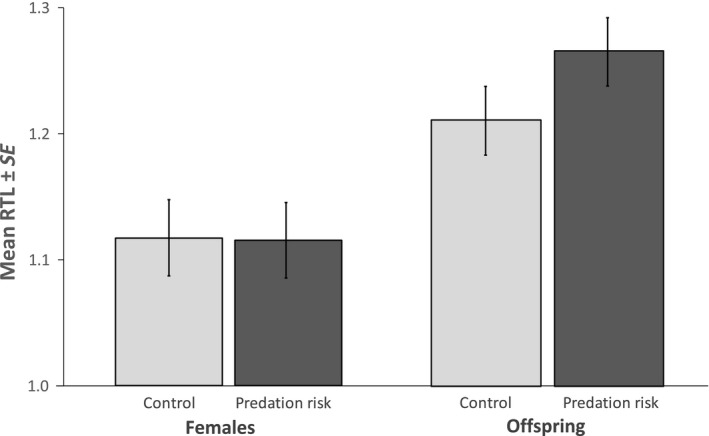
Relative telomere length of females and offspring of control and predation groups. Error bars represent the standard error of the mean observed values

Relative telomere length of females and offspring of control and predation groups. Error bars represent the standard error of the mean observed values