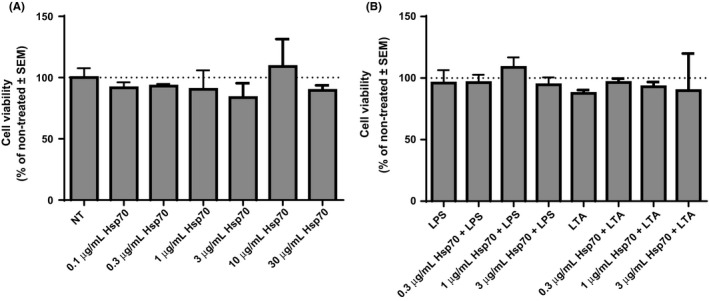
Figure 1.

Cytotoxicity of rhHsp70 (A), LPS and LTA alone, and their combinations with rhHsp70 (B), assessed by MTS assay. Data are presented as mean ± SEM from three independent experiments (n = 3). Dotted line represents viability of non‐treated cells set as 100%. LPS, lipopolysaccharide; LTA, lipoteichoic acid
