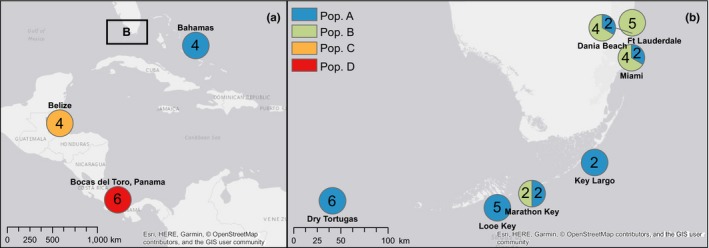
Figure 2.

Map of collection locations and population groups. Panel (a) shows the location of Populations C (Belize) and D (Panama) and samples of population A collected in the Bahamas. Panel (b) contains an inset map from panel (a), which shows the collection sites and population composition at each reef along the Florida Reef Tract. Unique population groups as identified in Chaves‐Fonnegra et al. (2015) are displayed as different colors. Numbers within each circle indicate the number of samples collected for each population at each site
