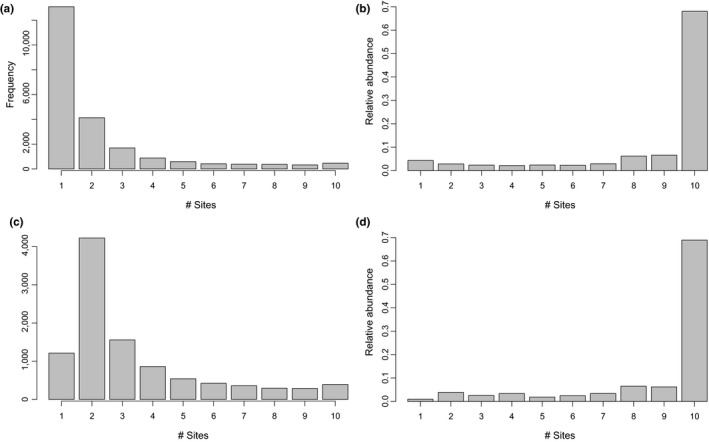
Figure 5.

OTU occurrence frequency and relative abundance across 10 collection sites for raw (A & B) and cleaned datasets (C &D). A & C show the number of OTUs that are present in 1–10 sites (x‐axis) in the current study. B & D display the relative abundance of OTUs that occur in the occurrence frequency bins shown in A & C
