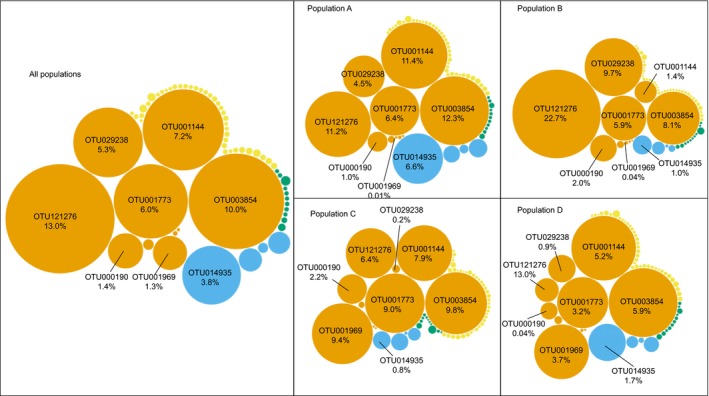
Figure 6.

Bubble plot of 63 core taxa in C. delitrix samples showing variability in the mean relative abundance in core OTUs among populations of C. delitrix. Each plot represents the same 63 core taxa, and the eight most abundant taxa (in all populations) are labeled with their respective OTU identities in each panel. Each bubble represents one core OTU, and bubble size indicates the relative abundance of an OTU. Core taxa categories are represented as different colors: Blue—Environmental; orange—Sponge‐enriched; green—Cliona‐specific; yellow—Cliona delitrix‐specific
