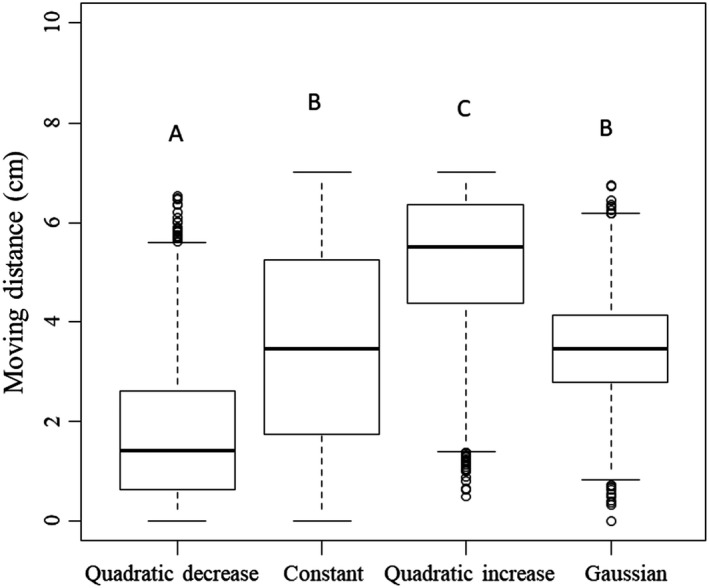
Figure 4.

Simulation results of average moving distance depending on distribution functions (quadratic decrease, constant, quadratic increase, and Gaussian). Thick lines in the boxes indicate the mean, and circles above and below the box are outliers. Different uppercase letters in the figure denote significant differences according to a pairwise comparison (α = 0.05)
