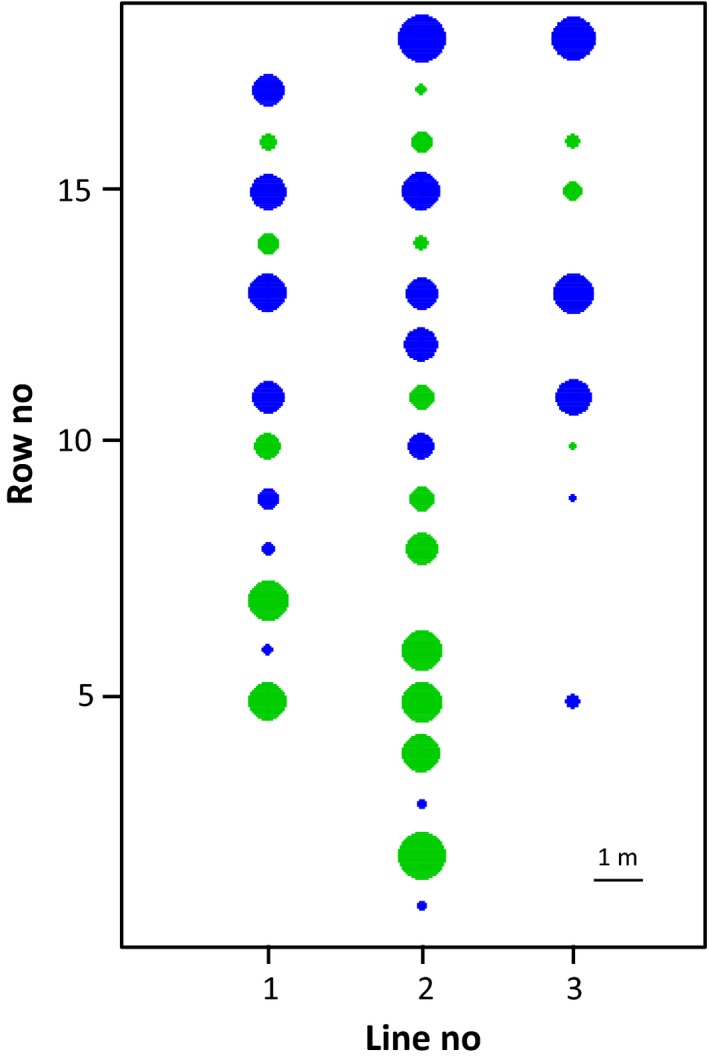
Figure 2.

Position of individuals in the experimental plot (see Table S1 and Figure S4) according to their mating group: group A in blue and group B in green. These two groups were defined on the first axis of the correspondence analysis (Table S3). Diameters of blue circles are proportional to coordinates along the second correspondence analysis axis, while for green circles their size is related to third axis coordinate (see Figure S3). For a given group, circle size similarity between individuals thus represents some similarity in mating pattern. For both groups, distribution of size similarity is not randomly distributed in the plot suggesting strong pollination limitation by distance (see also Figure 3)
