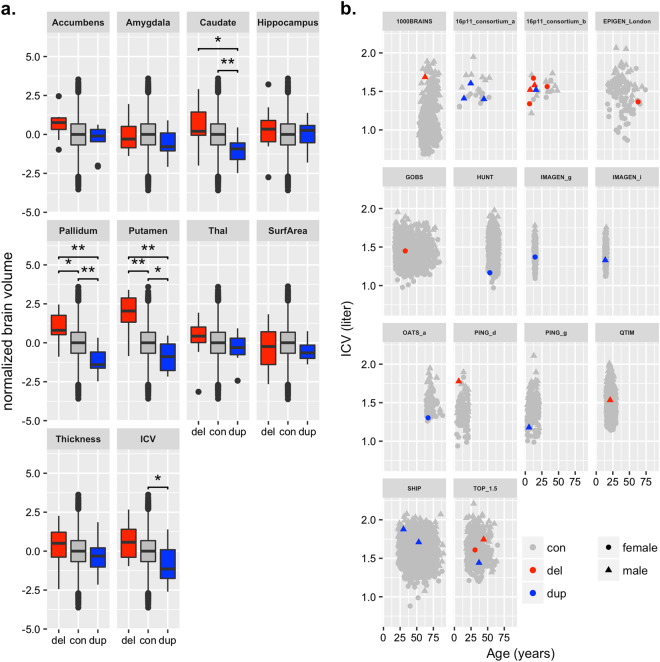
Fig. 2.
Measures of caudate, pallidum, putamen and ICV show a dose response to differences in copy number in the 16p11.2 distal region. All analyses were corrected for age, age squared, sex, scanner site and ICV (except for ICV). Deletion carriers (del) in red, non-carriers (con) in grey and duplication carriers (dup) in blue, respectively. a Boxplots of subcortical volumes, surface area and thickness and ICV. The normalized brain values are presented. Boxplots represent the mean. Significant differences after Bonferroni correction between groups are noted as *P < 0.005, **P < 0.0005. Centre line represents median, box limits are the upper and lower 25% quartiles, whiskers the 1.5 interquartile range and the points are the outliers. b Bivariate plot of age versus uncorrected ICV

