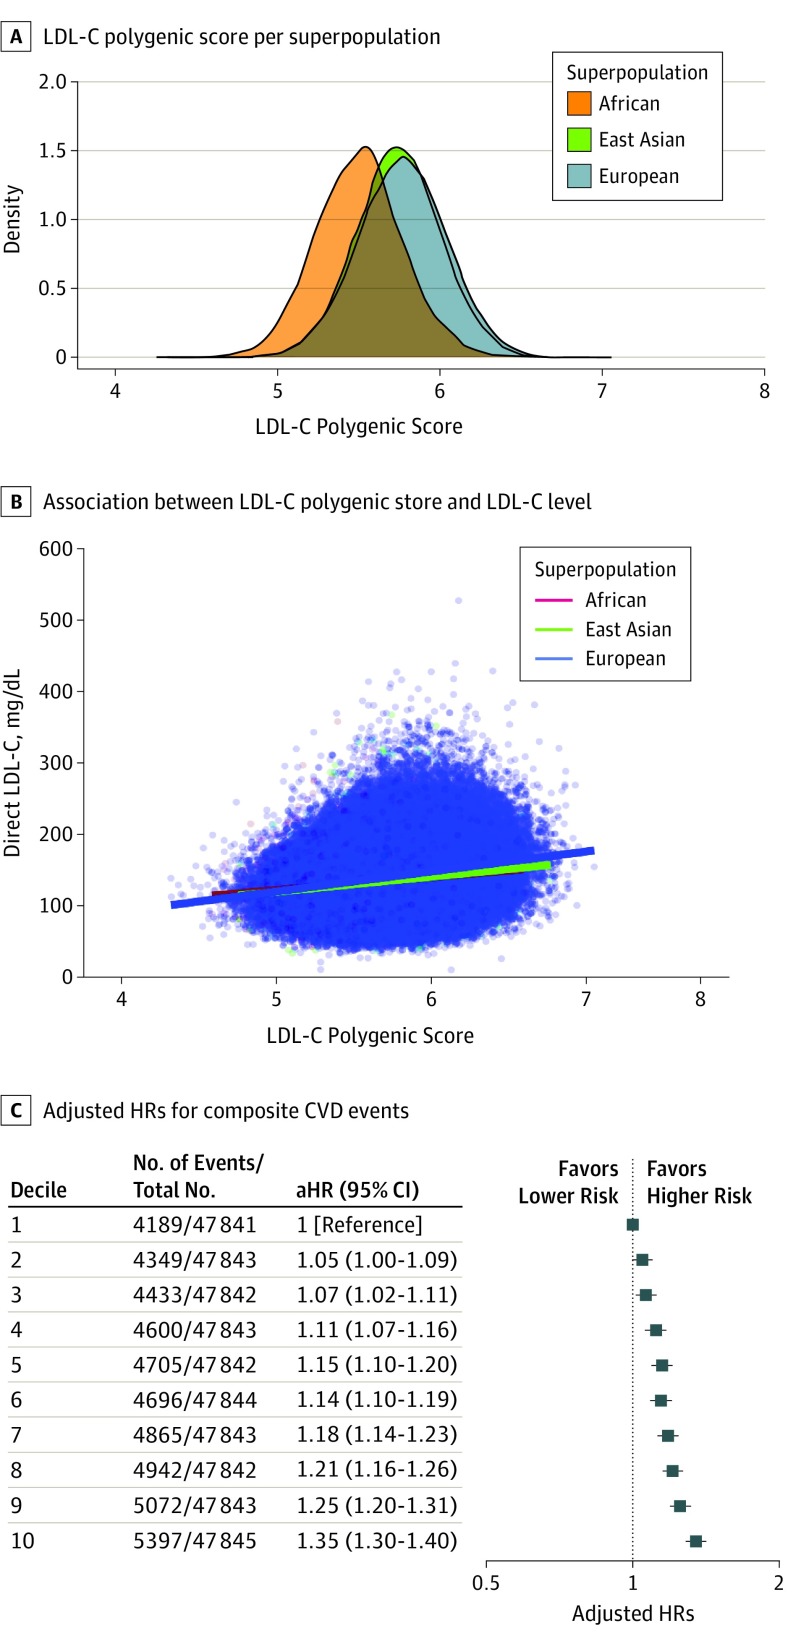
Figure 2. Low-Density Lipoprotein Cholesterol (LDL-C) Polygenic Scores and LDL-C Levels and Risk of Cardiovascular Disease (CVD) Among all Individuals in the Genotyping Array Cohort.
A, The distribution of LDL-C polygenic scores is depicted for the African, East Asian, and European ancestral superpopulations. B, The linear association between LDL-C polygenic scores and LDL-C levels (to convert to millimoles per liter, multiply by 0.0259) are depicted. Lines depict linear regression analyses segregated by ancestral superpopulation. C, The adjusted hazard ratios (aHRs) with 95% CIs for composite CVD events of myocardial infarction, coronary or carotid revascularization, ischemic stroke, or all-cause mortality are depicted for each decile of LDL-C polygenic score percentile (percentiles are calculated relative to each individual’s ancestral superpopulation). Hazard ratios were adjusted for age, sex, genotyping array and/or batch, and the first 4 principal components of ancestry.

