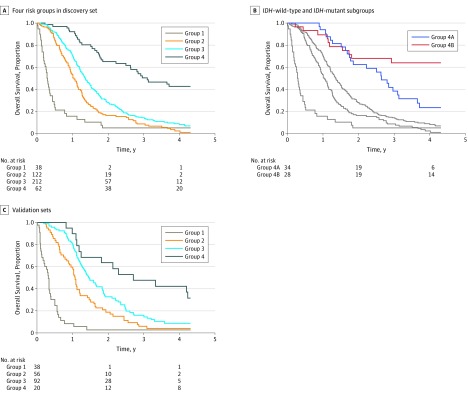
Figure 3. Kaplan-Meier Curves for Overall Survival for 4 Risk Groups.
Groups are described in Figure 2. A, Includes patients in the post-2005 isocitrate dehydrogenase gene 1 or 2 status (IDH)-known (n = 434). For group 1, median overall survival was 3.6 (95% CI, 2.6-5.4) months (univariable hazard ratio [HR], 3.31 [95% CI, 2.31-4.74]; P < .001); group 2, 12.4 (95% CI, 11.4-14.0) months (univariable HR, 1.45 [95% CI, 1.15-1.83]; P = .001); group 3, 16.5 (95% CI, 14.7-18.3) months (univariable HR, 1 [reference]); and group 4, 37.3 (95% CI, 31.6-70.7) months (univariable HR, 0.36 [95% CI, 0.25-0.51]; P < .001). B, Includes groups 1 to 3 (gray) and the 2 subgroups in group 4. Group 4A represents the temozolomide-treated patients with IDH–wild-type tumors who were younger than 65 years and with no more than 5.4 mL of non–contrast-enhancing residual tumor (median overall survival, 31.7 [95% CI, 22.2-43.9] months); group 4B, the temozolomide-treated patients with IDH-mutant tumors (median overall survival, 78.4 [95% CI, 35.1-not applicable] months). C, Includes Mayo Clinic (n = 107) and Ohio Brain Tumor Study (n = 99) patients with glioblastoma. Median overall survival for group 1 was 3.8 (95% CI, 2.4-4.6) months (univariable HR, 6.17 [95% CI, 4.08-9.33]; P < .001); group 2, 12.8 (95% CI, 10.9-14.6) months (univariable HR, 1.58 [95% CI, 1.11-2.25]; P = .01); group 3, 17.5 (95% CI, 15.3-22.5) months (univariable HR, 1 [reference]); and group 4, 32.4 (95% CI, 21.7-not applicable) months (univariable HR, 0.54 [95% CI, 0.31-0.94]; P = .03).

