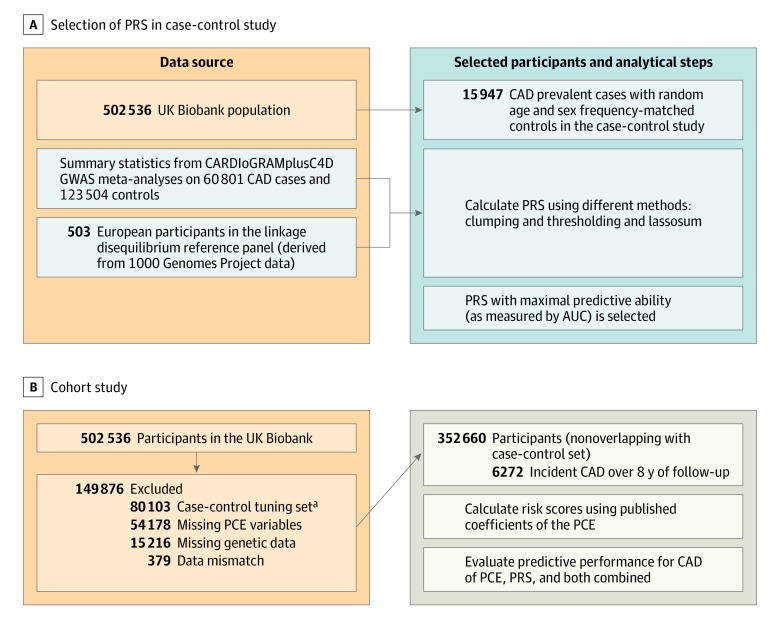
Figure 1. Study Design and Flowchart for Coronary Artery Disease (CAD).
To select the method with the best discrimination based on area under the curve (AUC), clumping and thresholding and lassosum were used to calculate polygenetic risk scores (PRS) applied to a case-control set (prevalent cases). For this calculation, summary data from the largest genome-wide association study (GWAS) on CAD (CARDIoGRAMplusC4DREF15) that excludes UK Biobank and data on linkage disequilibrium were used. The resulting PRS was applied to a nonoverlapping set of participants from the UK Biobank with no preexisting cardiovascular disease, aged 40 to 69 years at baseline, and who were followed up for incident CAD events. In this population, the pooled cohort equations (PCE) model was calculated and different models (PRS, PCE, and PCE enhanced with PRS) were compared in terms of their predictive accuracy based on discrimination, calibration, and reclassification metrics.
aCAD and cardiovascular disease tuning sets combined.

