
Figure 9.
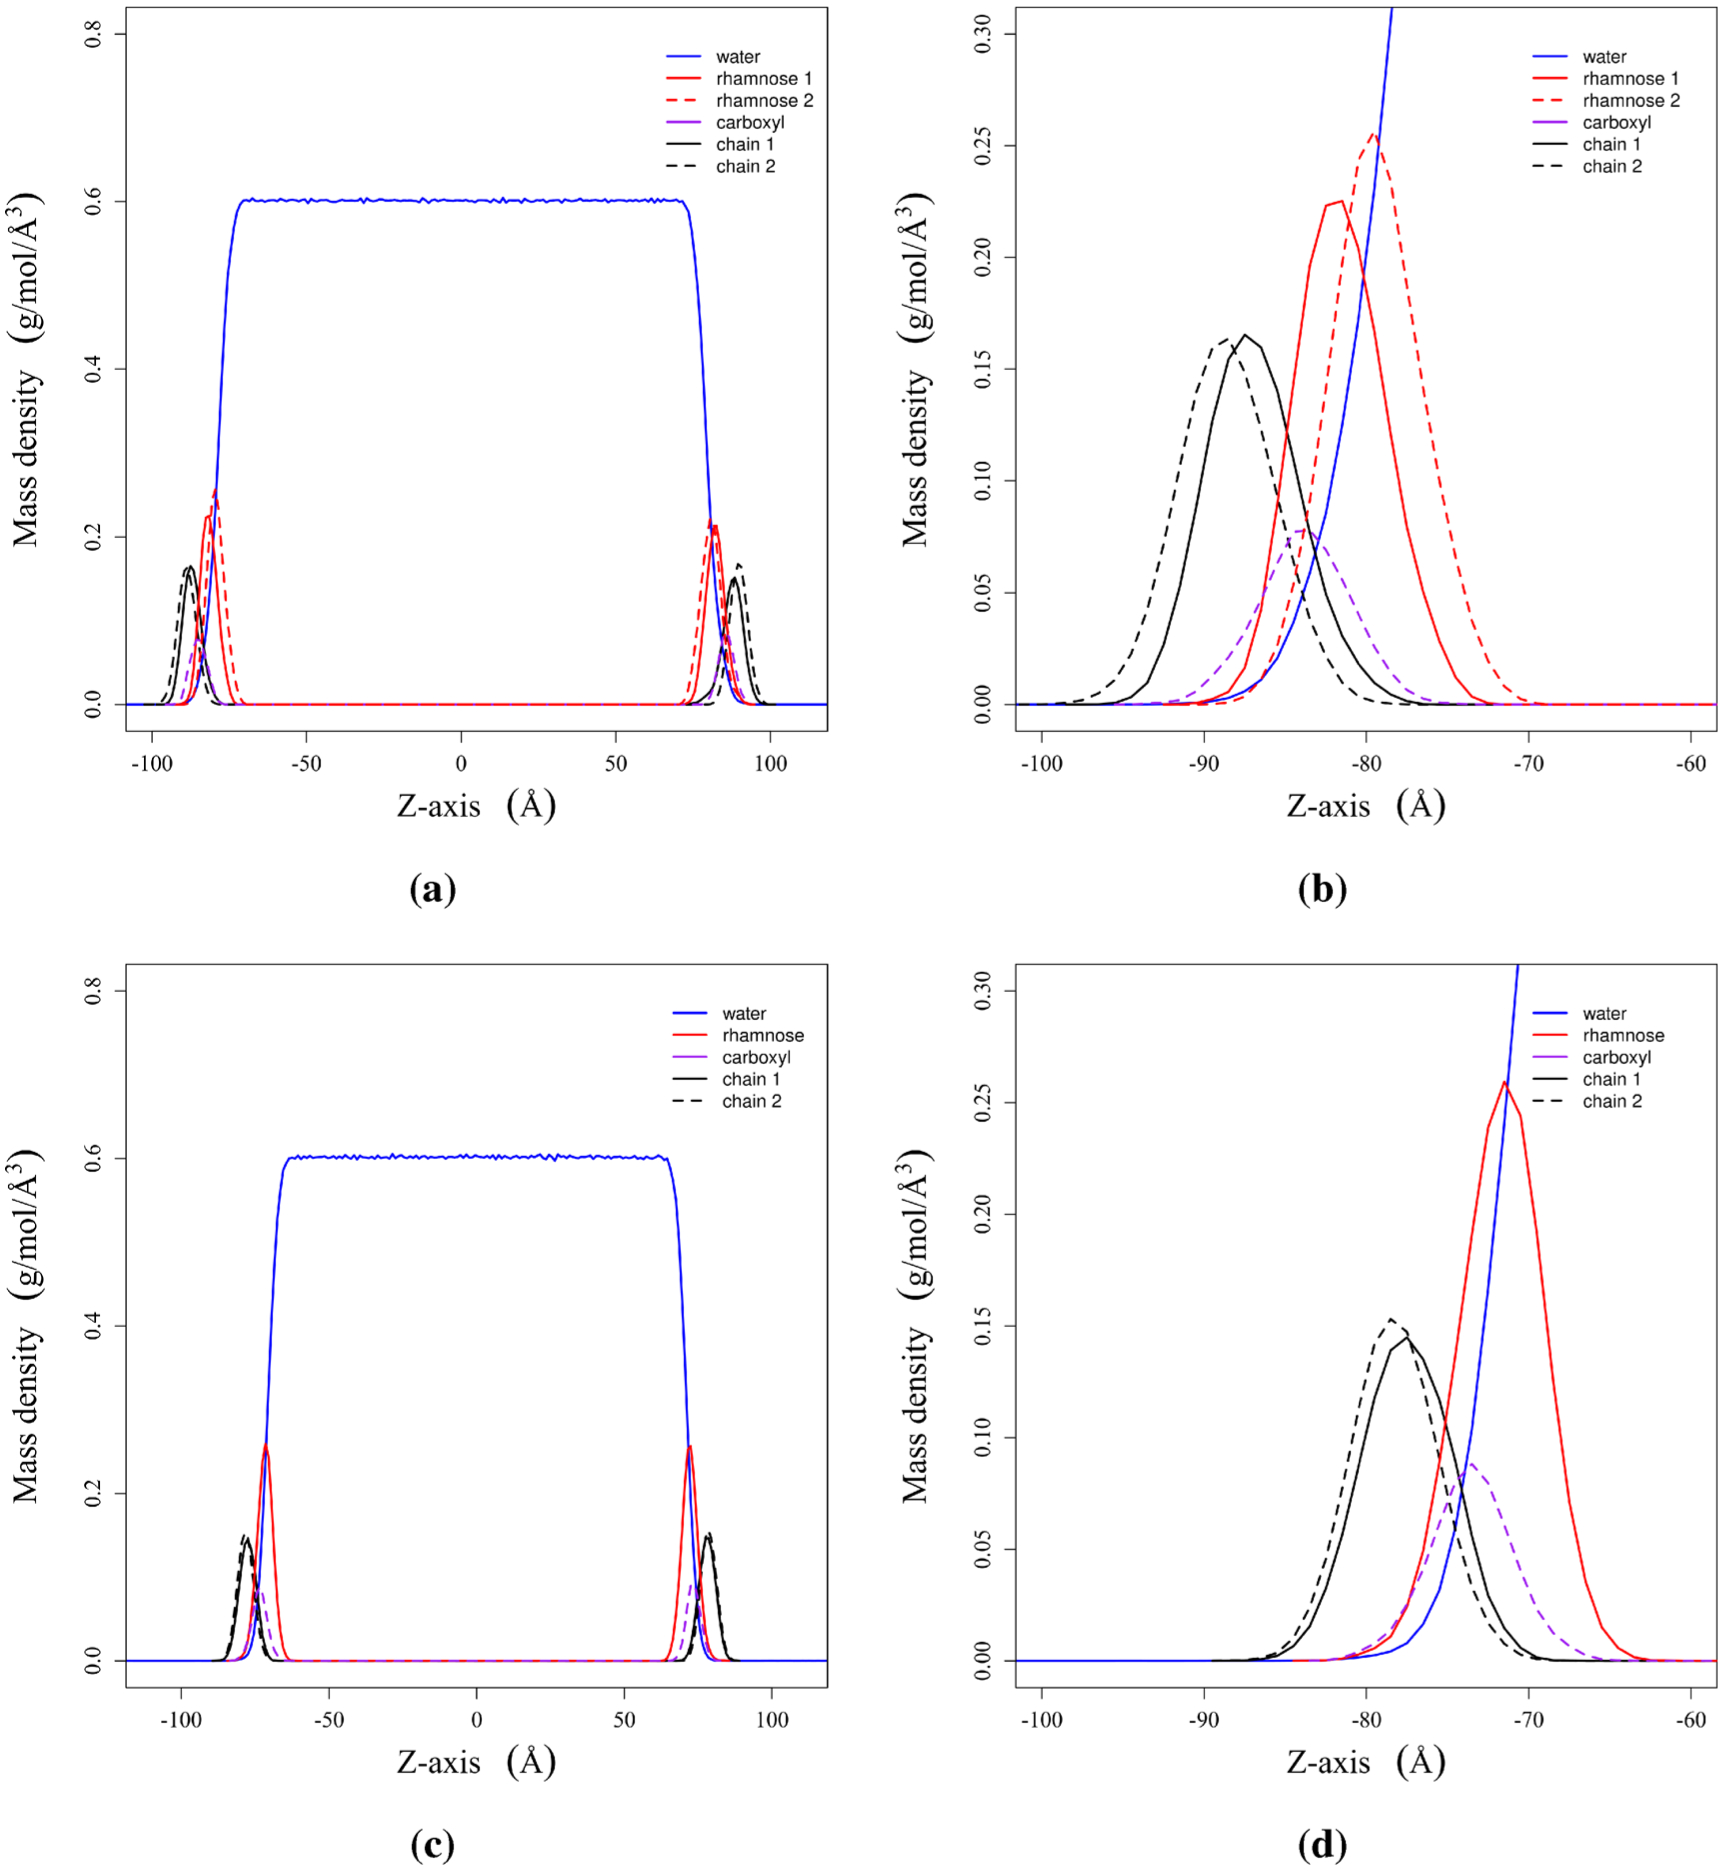
Mass density plots for (a) dRL and (c) mRL aggregation at the air–water interface. Plots (b) and (d) are enlarged versions of the same figures to the immediate left. See Figure 2 for the molecular components that are referenced.
Official websites use .gov
A
.gov website belongs to an official
government organization in the United States.
Secure .gov websites use HTTPS
A lock (
) or https:// means you've safely
connected to the .gov website. Share sensitive
information only on official, secure websites.
Mass density plots for (a) dRL and (c) mRL aggregation at the air–water interface. Plots (b) and (d) are enlarged versions of the same figures to the immediate left. See Figure 2 for the molecular components that are referenced.