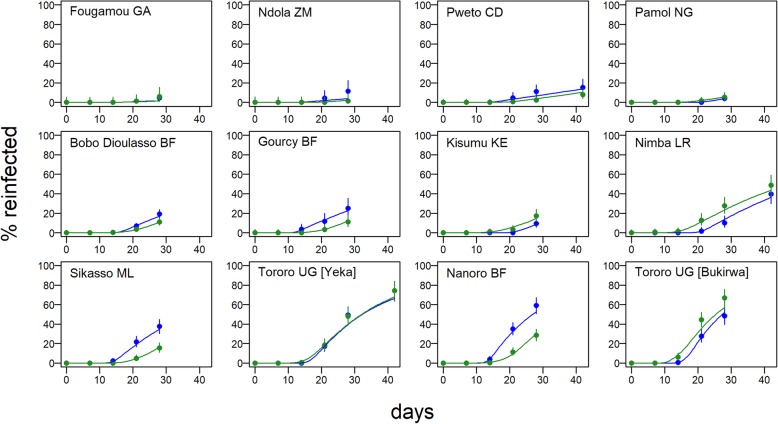
Fig. 2.
Time to reinfection after treatment and model fits. Proportion of patients reinfected (after PCR correction) during follow-up after treatment at day 0 with AL (blue) or AS-AQ (green) in each of the 12 trial sites. Circles show data with 95% CI, and the lines are the fits of the hidden semi-Markov model in each site. The AL trial arms include in total 2086 individuals and 642 reinfections and the AS-AQ trial arms, 2128 individuals and 538 reinfections

