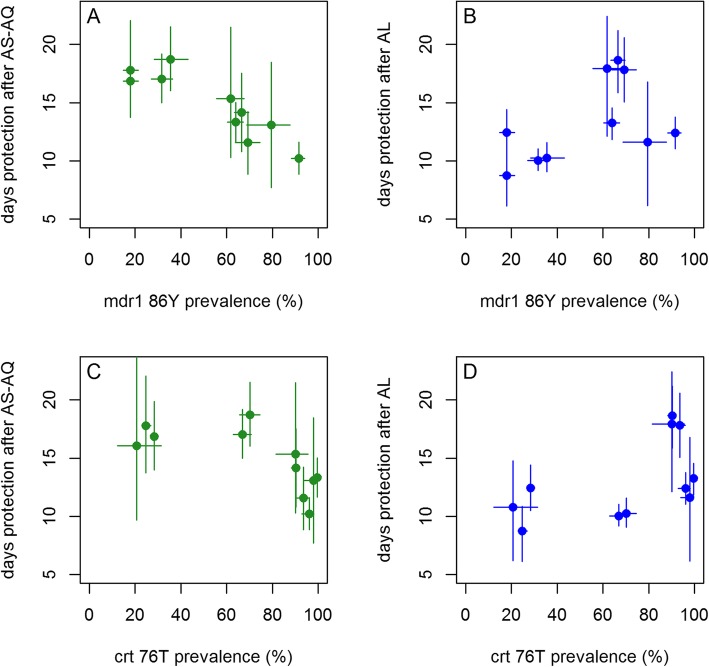
Fig. 4.
Duration of protection after treatment with a, c AS-AQ and b, d AL, according to local pfmdr1 N86Y (a, b) and pfcrt K76T mutation prevalence (c, d). Median posterior estimates of duration of protection from hidden Markov model analysis are shown (points) with 95% credible intervals (vertical lines). Local pfmdr1 N86Y and pfcrt K76T mutation prevalences are from matched surveys within 1 year and 300 km in the same country as each trial. Horizontal lines indicate the 95% confidence intervals of the mutation prevalence estimates

