
Figure 2. Spectrum of major co-occurring genomic alterations in KRAS- and EGFR-mutant lung adenocarcinoma.
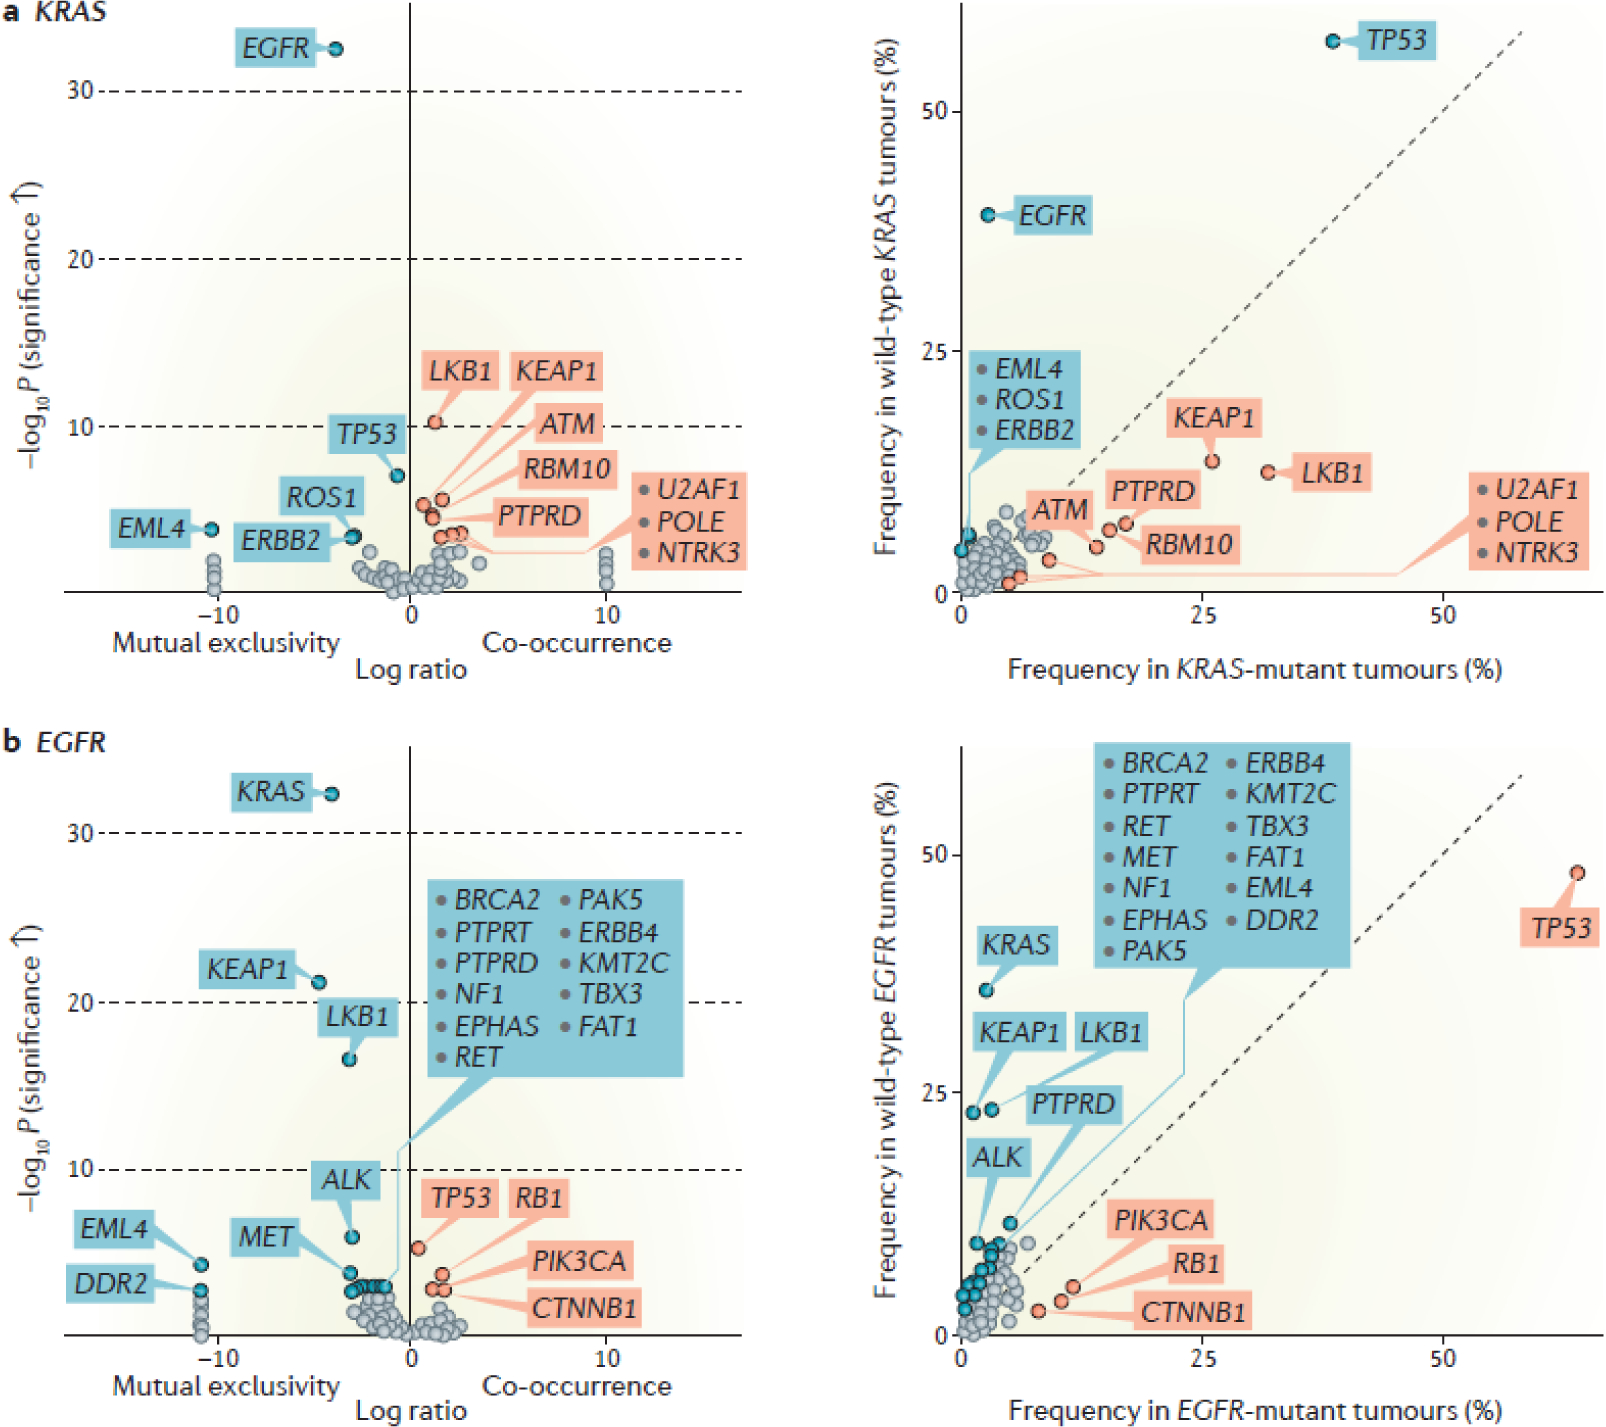
Volcano plots (left graphs) summarizing enrichment of individual co-alterations in: KRAS-mutant compared with KRAS-wild-type LUADs (a) and EGFR-mutant compared with EGFR-wild-type LUADs (b). The magnitude of co-mutation enrichment is indicated on the x-axis and is expressed as log2 (% in KRAS-mutant / % in KRAS-wild-type) or log2 (% in EGFR-mutant / % in EGFR-wild-type) respectively, whereas the statistical significance of the association is plotted on the y-axis and is expressed as –log10P value (derived from a Fisher’s exact test). Significantly enriched co-mutations based on a q value <0.05 (derived from Benjamini-Hochberg procedure182) are highlighted in red, whereas under-represented genomic events are highlighted in blue. The prevalence of each co-alteration in KRAS-mutant and KRAS-wild-type groups (or EGFR-mutant and EGFR-wild-type groups) is shown in the adjacent frequency plots (right graphs of parts a and b). Targeted next generation sequencing-based molecular profiling (MSK-IMPACT platform) from 860 patients with metastatic LUAD treated at Memorial Sloan Kettering Cancer Center were included in this enrichment analysis that was performed using the cBioPortal web program180, 181. Oncogene-driver specific, non-random patterns of co-occurring alterations in key tumor suppressor genes are evident for both KRAS-mutant and EGFR-mutant tumors.