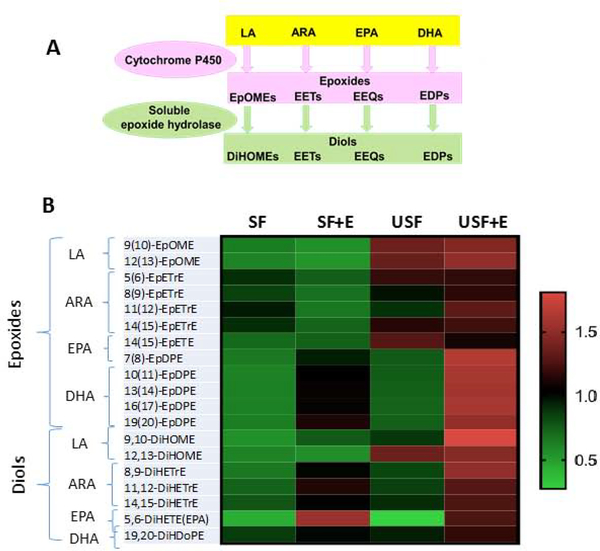
Figure 1.
Diet-specific alterations in oxylipin profiles in response to EtOH administration. A. Schematic representation of the CYP and sEH metabolic pathways of epoxide and diol production. B: Changes in the abundance of individual epoxides and diols between experimental groups. Results are expressed as a matrix view (heat map) where rows represent individual oxylipins and columns represent group distribution. The intensity of each color denotes the standardized ratio between each sample value and the average levels of each individual oxylipin across all samples. ARA, arachidonic acid; DHA, docosahexaenoic acid; DiHDoPEs, dihydroxy-docosapentaenoic acids; DiHETEs, dihydroxy-eicosatetraenoic acids; DiHOMEs, dihydroxy-octadecenoic acid; EPA, eicosapentaenoic acids; EpDPEs, epoxy-docosapentaenoic acids; EpETE, epoxy-eicosatetraenoic acids; EpETrEs=EETs, epoxy-eicosatrienoic acids; EpOMEs, epoxy-octadecenoic acid; Et, ethanol; LA – linoleic acid, SF, saturated fat; USF, unsaturated fat. P < 0.05 a: SF vs SF+Et; b: USF vs USF+Et; c: SF+ET vs USF+Et; d: SF vs USF

