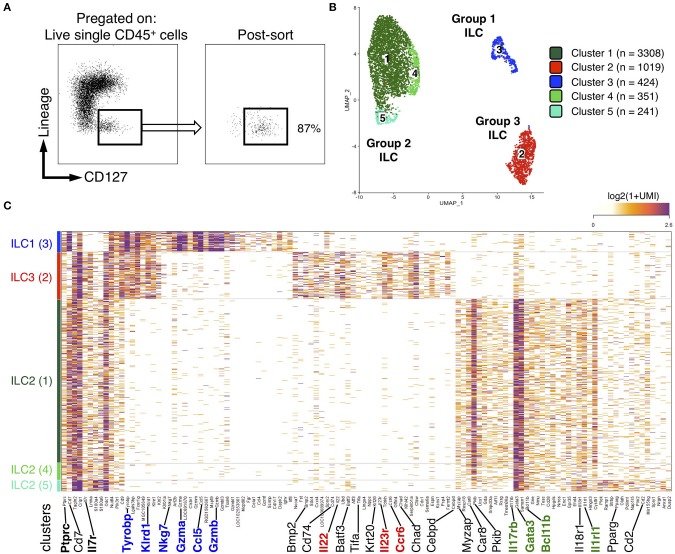
Figure 2.
scRNAseq reveals distinct clusters of ILCs from colon LP of rat. (A) FACS-sorting plots showing the sorted CD45+ Lin− CD127+ ILCs from the colon LP of one SPD rat (left panel) and cells purity after sorting (right panel). (B) Uniform manifold approximation and projection (UMAP) visualizing clusters of colonic Lin− CD127+ cells analyzed by scRNAseq (n = 1 SPD rat). (C) Heatmap visualization color-coding the mRNA (UMI) counts per single cells (stacked rows) for selected genes (columns). Visualized are randomly selected cells, which were downsampled to 2,000 UMIs/cell. Clusters are separated by gray bars and ordered by ILC subtype.

