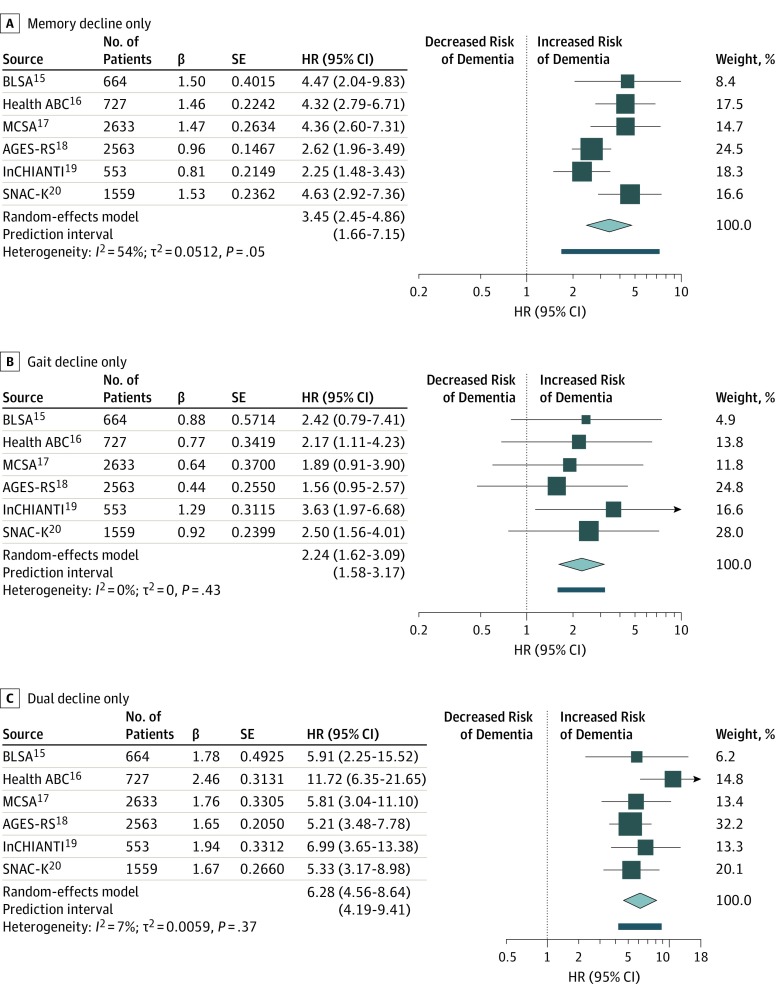
Figure. Forest Plots of Hazard Ratios (HRs) for Dementia Risk in Phenotypic Groups.
A, Participants with only memory decline compared with those with no decline in memory or gait speed. B, Participants with gait decline only compared with those with no decline in memory or gait speed. C, Participants with dual decline compared with those with no decline in memory or gait speed. The sizes of the data markers indicate the size of each study; the larger the data marker, the more participants were in the study. AGES-RS indicates the Age, Gene/Environment Susceptibility-Reykjavik Study; BLSA, the Baltimore Longitudinal Study of Aging; Health ABC, the Health, Aging and Body Composition Study; InCHIANTI, Invecchiare in Chianti, Aging in the Chianti Area; MCSA, the Mayo Clinic Study of Aging; and SNAC-K, the Swedish National Study on Aging and Care-Kungsholmen Population Study. SE indicates standard error.

