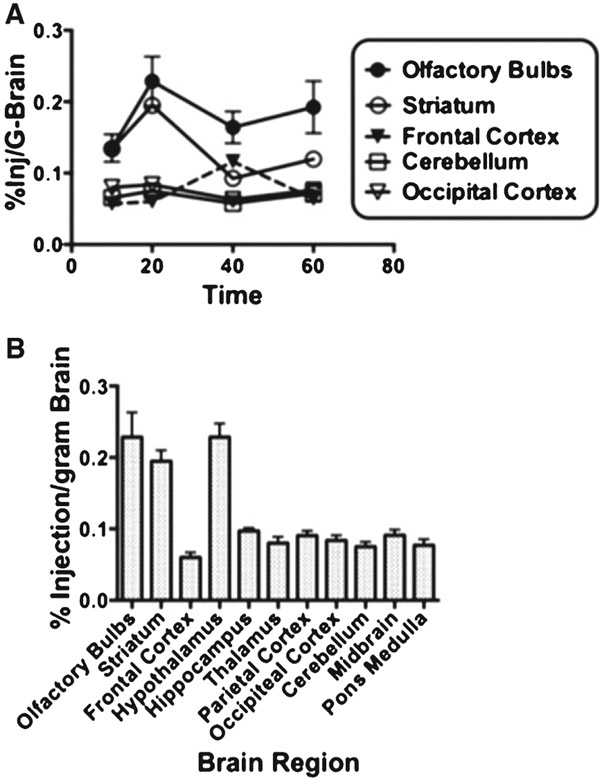
Fig. 1.
Brain distribution of paclitaxel after intranasal administration. A) Time-activity curves compare the % Inj/g-brain in five brain regions. Although there are regional differences, tissue concentrations are stable over the 1 hour of sampled time. B) All brain region concentrations of 3H-paclitaxel at the 20 min time point from after IN administration show a classic pattern of high olfactory bulb uptake; however, the high striatum and hypothalamus uptake is unique. Results are expressed as the percent of administered dose taken up by a gram of brain region. Error bars indicate standard deviation across the group (n = 5).

