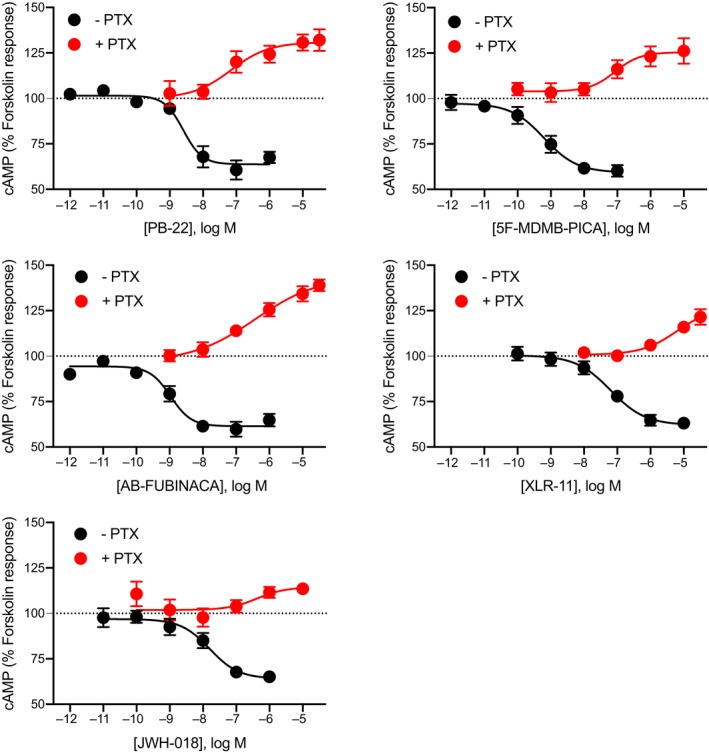
Figure 3.

Concentration response curves for SCRAs‐induced stimulation and inhibition of cAMP signaling. Pooled concentration response relationship for five SCRAs (PB‐22, 5F‐MDMB‐PICA, AB‐FUBINACA, XLR‐11, and JWH‐018) for two signaling outputs of cannabinoid receptor type 1—stimulation and inhibition of cAMP levels following overnight treatment in the absence (−PTX, black), or presence (+PTX, red) of PTX. Data were normalized to forskolin (FSK, 100%) and vehicle (0%), and plotted as mean ± SEM for at least five independent experiments performed in duplicate. For some points, the error bars are shorter than the height of the symbol. BRET, bioluminescence resonance energy transfer; cAMP, cyclic adenosine monophosphate; PTX, pertussis toxin; SCRA, synthetic cannabinoid receptor agonist
