Figure 1.
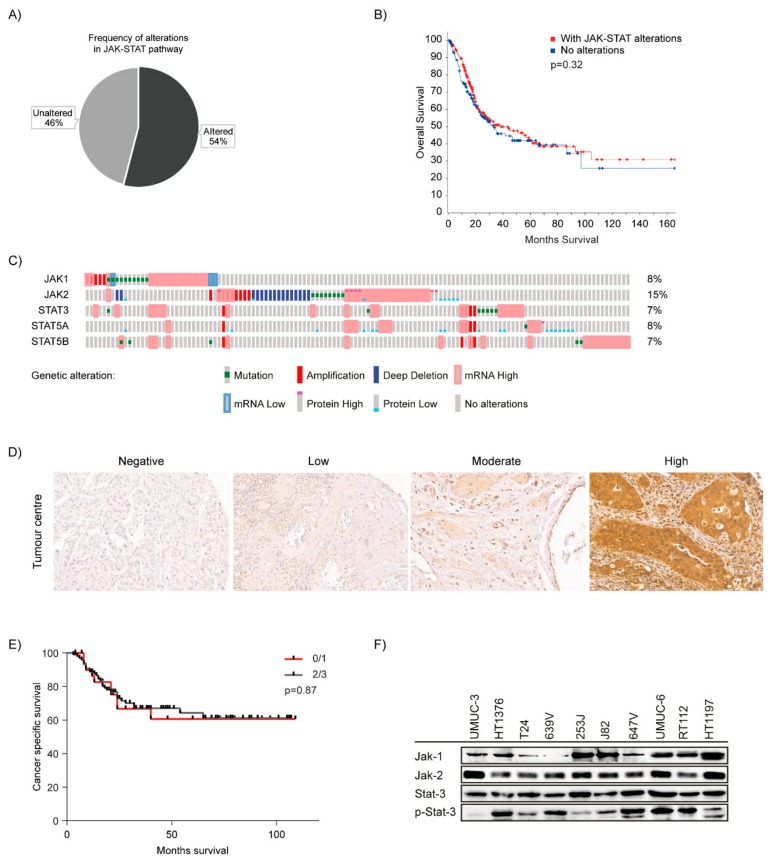
JAK-STAT pathway in bladder cancer: (A) TCGA cohort of 412 patients (413 samples) was analysed using cBioPortal. JAK-STAT pathway was altered in 54% of bladder cancer specimens. (B) Kalpan-Meier plot depicting overall survival analysis among patients with and without alterations in JAK-STAT pathway in the TCGA cohort. (C) Alterations in JAK1, JAK2, STAT3, STAT5A and STAT5B genes—OncoPrint indicates tumours altered with mutations (green bars), amplification (red bars), homozygous deletion (blue bars), high mRNA (red—outlined bars), mRNA low (blue-outlined bars), protein high (bars with red cap), protein low (blue-bottomed bars) and no alterations (grey bars). (D) Immunohistochemistry of patient tissues stained for STAT3- images showing staining intensities- Negative (Score-0), Low (Score-1), Moderate (Score-2), High (Score-3). Tissue sections were imaged at 200× magnification. (E) Kaplan-Meier plots for cancer specific survival analysis among patients with no or low STAT3 staining vs. moderate/high STAT3 staining. (F) Cell lines were analysed for Jak1, Jak2, Stat3 expression and Stat3 phosphorylation by immunoblotting.

