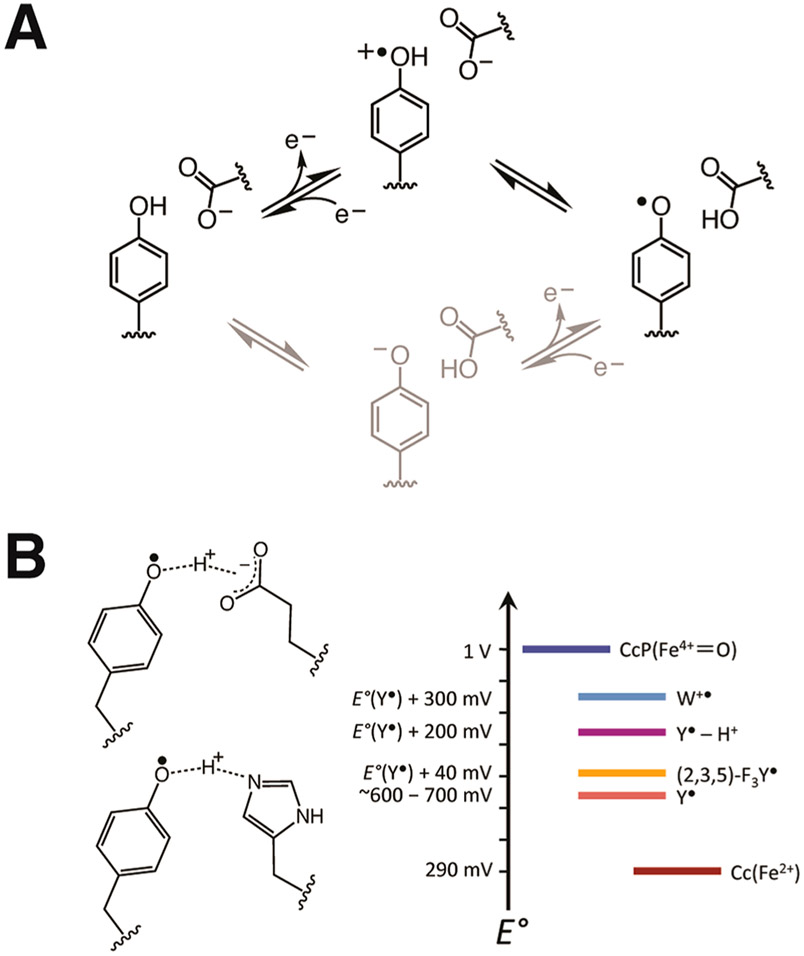
Figure 9.
(A) Schematic of stepwise ETPT (black) and PTET (gray) mechanisms for Tyr oxidation. Data presented in Figure 8 support an ETPT pathway for Tyr• reduction by Cc(Fe2+) (gray; right to left). (B) Changes in Tyr191• formal potential owing to substitution by non-natural FTyr or addition of a hydrogen bond donor to the phenolic oxygen shown relative to the potentials of Cc(Fe2+)72 and CcP(Fe4+).123,124,136

