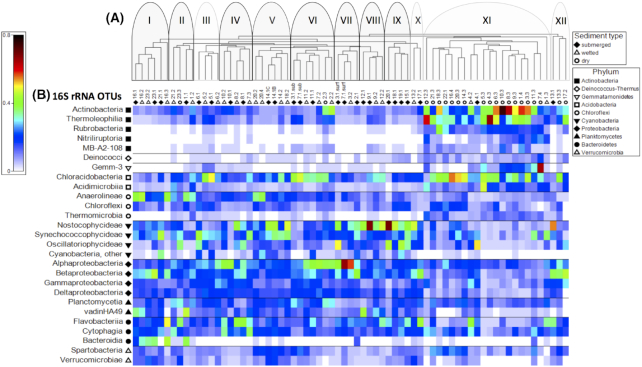
Figure 4.
(A) Cluster analysis of samples based on 16S rRNA OTUs. Samples are identified based on collection point along a transect including submerged (closed diamonds), wetted (open triangles) and dry (open circles) samples. Twelve clusters were identified loosely based on absence of visible mat or location (see text for details). Clusters outlined in black and shaded in gray indicate sites that were also positive for nifH. (B) Shade plot of standardized and square root-transformed 16S rRNA OTU relative abundance within a taxonomic class and arranged according to phylum.

