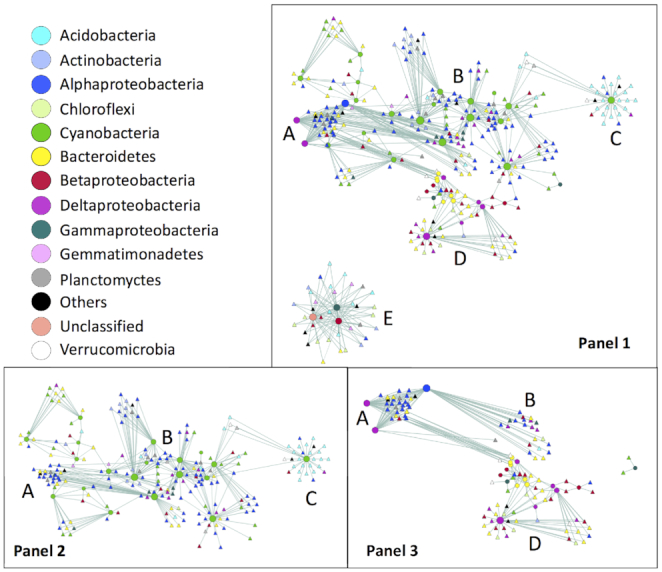
Figure 5.

Network analysis illustrating significant correlations between nifH and 16S rRNA OTU abundance for 18 sites included in the nifH library. Node color indicates phylum except for Proteobacteria, which are identified to the class level. nifH (circles) and 16S rRNA OTUs (triangles) are connected by edges, where the edge thickness is proportional to the significance of the correlation (merged P-value) and the sizes of the nifH nodes are proportional to the number of edges connecting them. Panel 1: all nodes; Panel 2: Cyanobacteria nifH and associated 16S rRNA nodes only; Panel 3: heterotrophic nifH and associated 16S rRNA nodes only. A, B, C, D and E are for orientation and refer to groups of nodes described in greater detail in the text.
