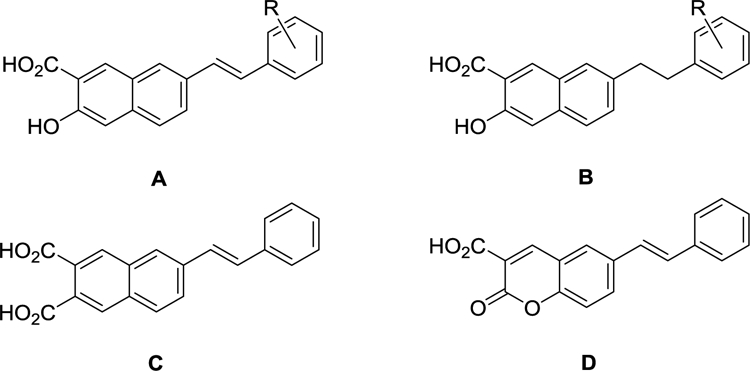
Table 5.
SAR studies on naphthalene derivatives as NMDAR NAMs. Values are percentage response for agonist (10 μM L-glutamate/10 μM glycine) in presence of test compound (100 μM) compared to agonist alone.
 |
||||||
|---|---|---|---|---|---|---|
| NMDAR (n≥4)a | ||||||
| Compound | Formula | R | GluN2A | GluN2B | GluN2C | GluN2D |
| 7 | - | - | 28.4 ± 2.6 | 49.9 ± 9.0 | 26.1 ± 1.7 | 26.1 ± 4.6 |
| 79a | A | H | 32.7 ± 3.8 | 7.3 ± 1.6 | 21.7 ± 0.7 | 11.3 ± 3.3 |
| 85 | C | - | 55.0 ± 12.6 | 66.7 ± 14.2 | 37.1 ± 6.8 | 38.6 ± 6.1 |
| 88 | D | - | 95.1 ± 12.4 | 92.0 ± 5.6 | 114.3 ± 8.6 | 118.9 ± 7.9 |
| 81a | B | H | 71.4 ± 14.3 | 54.3 ± 9.0 | 46.8 ± 5.7 | 32.1 ± 2.9 |
| 79b | A | o-CO2H | 92.1 ± 5.9 | 84.5 ± 2.8 | 83.7 ± 3.1 | 102.6 ± 5.0 |
| 81b | B | o-CO2H | 91.8 ± 15.7 | 85.2 ± 2.4 | 94.1 ± 1.5 | 80.7 ± 1.7 |
| 79c | A | m-CO2H | 90.3 ± 4.3 | 70.0 ± 5.7 | 76.8 ± 3.7 | 61.4 ± 2.1 |
| 79d | A | p-CO2H | 89.7 ± 3.2 | 89.0 ± 6.0 | 85.2 ± 2.7 | 67.0 ± 11.0 |
| 81c | B | p-CO2H | 101.9 ± 4.3 | 95.8 ± 7.6 | 114.6 ± 6.1 | 92.6 ± 2.2 |
| 79e | A | o-OMe | 105.0 ± 12.3 | 74.0 ± 18.3 | 61.7 ± 15.6 | 71.0 ± 9.3 |
| 79f | A | m-OMe | 52.4 ± 10.2 | 24.9 ± 3.7 | 30.8 ± 4.9 | 29.9 ± 5.1 |
| 79g | A | p-OMe | 42.7 ± 20.6 | 36.0 ± 6.6 | 39.6 ± 7.2 | 39.0 ± 10.0 |
| 79h | A | o-NO2 | 80.5 ± 4.7 | 56.1 ± 7.8 | 35.1 ± 3.2 | 26.8 ± 3.4 |
| 79i | A | m-NO2 | 50.5 ± 11.0 | 28.8 ± 5.5 | 24.4 ± 5.3 | 30.7 ± 7.0 |
| 79j | A | p-NO2 | 47.4 ± 5.7 | 53.2 ± 6.7 | 43.3 ± 5.1 | 34.4 ± 2.0 |
Compounds were tested by TEVC for activity at recombinant NMDA receptors (GluN1a and the indicated GluN2 subunit) expressed in Xenopus oocytes. After obtaining a steady state NMDAR response evoked by 10 μM L-glutamate and 10 μM glycine, test compounds (100 μM) were co-applied with agonists. Values (mean ± s.e.m.) represent the % response in the presence of the test compound compared to response in the presence of agonists alone. Values >100 represent potentiation and those < 100 represent inhibition of the agonist response.
