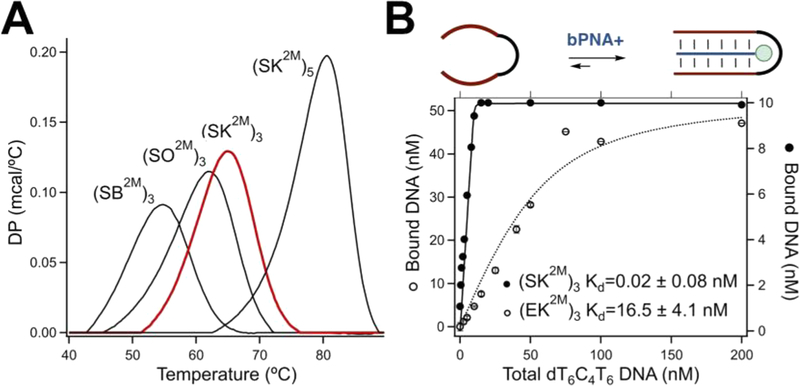
Figure 2.
(A) DSC traces of serine bPNA(+) complexes with dT6C4T6DNA at 1:1 stoichiometry, as labeled, at 25 μM DNA and bPNA+; (SK2M)5 is complexed with dT10C4T10. The (SK2M)3 trace is highlighted in red. All experiments were carried out in DPBS pH 7.4. (B) (Top) Illustration of hexapeptide bPNA(+) hybridizing with dT6C4T6 DNA with T-domains shown as red lines. (Lower) Binding isotherms of FITC-labeled bPNA+ (blue line) and dT6C4T6. Isotherms acquired by fluorescence anisotropy (EK2M)3 and electrophoretic mobility shift assay (SK2M)3. DNA concentration is 50 nM with (EK2M)3 (○) and 10 nM with (SK2M)3 (·).

