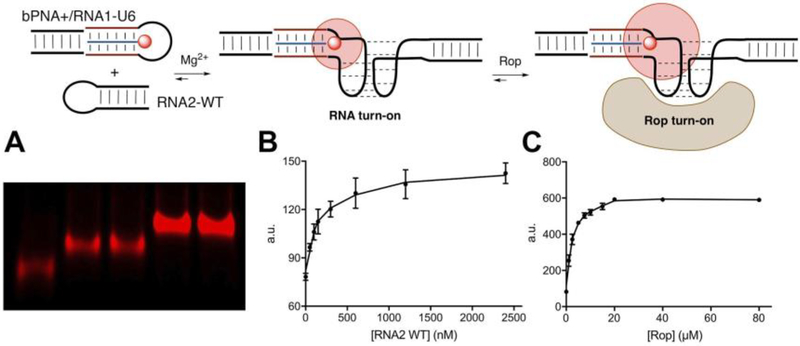
Figure 5.
(Top, left) Illustration of Cy5 emission turn-on from (left) [Cy5-(SK2M)3·RNA1-U6] complex (U6 = red) engaging with wild-type stem–loop RNA2 to form (middle) a kissing loop dimer which then binds Rop protein (right). RNA1-U6: 5′-GGCAGCUUUUUUUUGGUAGUUUUUUGCUGCC-3′; RNA2-WT: 5′-GCACCGCUACCAACGGUGC-3′. (A) Native polyacrylamide gel imaged by Cy5 fluorescence also indicates an increase in emission (from left) of 500 nM [Cy5-(SK2M)3·RNA1-U6] (lane 1), [Cy5-(SK2M)3·RNA1-U6] with 500 nM (lane 2), and 1 μM (lane 3) wild-type RNA2; [Cy5-(SK2M)3·RNA1-U6] kissing complex with RNA2 at 500 nM with 5 μM (lane 4) and 10 μM (lane 5) Rop protein. Solution experiments confirm increases in Cy5 emission in (B) [Cy5-(SK2M)3·RNA1-U6] as a function of RNA2 WT concentration and (C) the kissing loop complex as a function of Rop protein concentration.

