Figure 3.

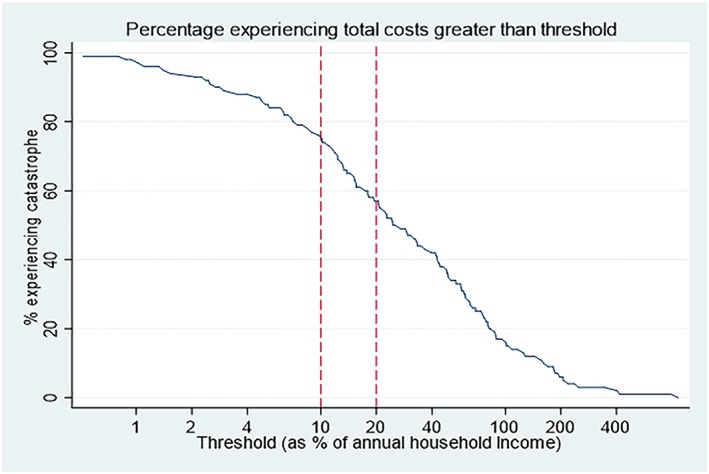
Percentage experiencing total costs greater than threshold [Colour figure can be viewed at http://wileyonlinelibrary.com]

Percentage experiencing total costs greater than threshold [Colour figure can be viewed at http://wileyonlinelibrary.com]