. 2020 Feb 21;69(7):183–188. doi: 10.15585/mmwr.mm6907a2

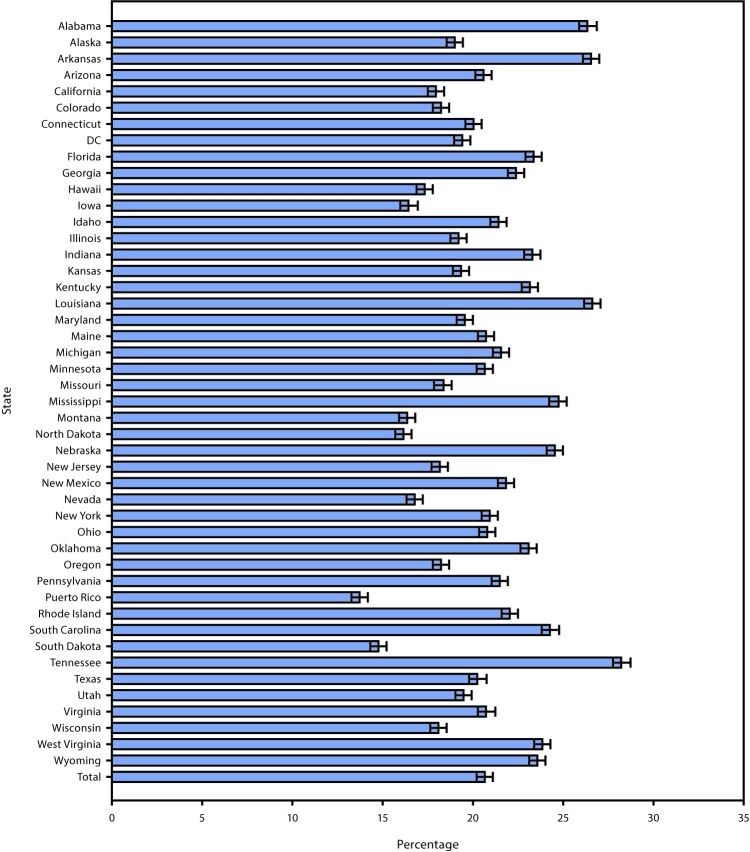
FIGURE 1.

The figure is a bar graph showing the percentage of respondents self-reporting as informal, unpaid caregivers in the United States during 2015–2017, by state, based on data from the Behavioral Risk Factor Surveillance System.

Percentage of respondents self-reporting as informal, unpaid caregivers, by state — Behavioral Risk Factor Surveillance System, United States, 2015–2017 *

Abbreviation: DC = District of Columbia.

* With 95% confidence intervals presented as error bars.